HubSpot Platform design
Evolving HubSpot’s Visualization Framework
- Role
- Senior Product Designer
- Other teams
- Deals
- Sales
- Sales Deal Progression
- Help Desk
- Projects
- Marketing Studio
- Trellis (Design Systems)
- Timeline
- 2025 – 2026
- Outcome
- Reduction in support tickets and feature requests
- Adoption of visualizations by other product teams
Summary
I transformed HubSpot’s visualizations and created a framework other teams could build upon, defining core interaction, visual, and feature foundations that became the standard for other designers and teams to use.
The problem
Leadership had noted that the Board was in need of a redesign, but what exactly needed improving was up to me to find out. Additionally, all the visualizations felt inconsistent and lacked a proper framework, and multiple teams that relied on them kept making changes that created even more inconsistency.
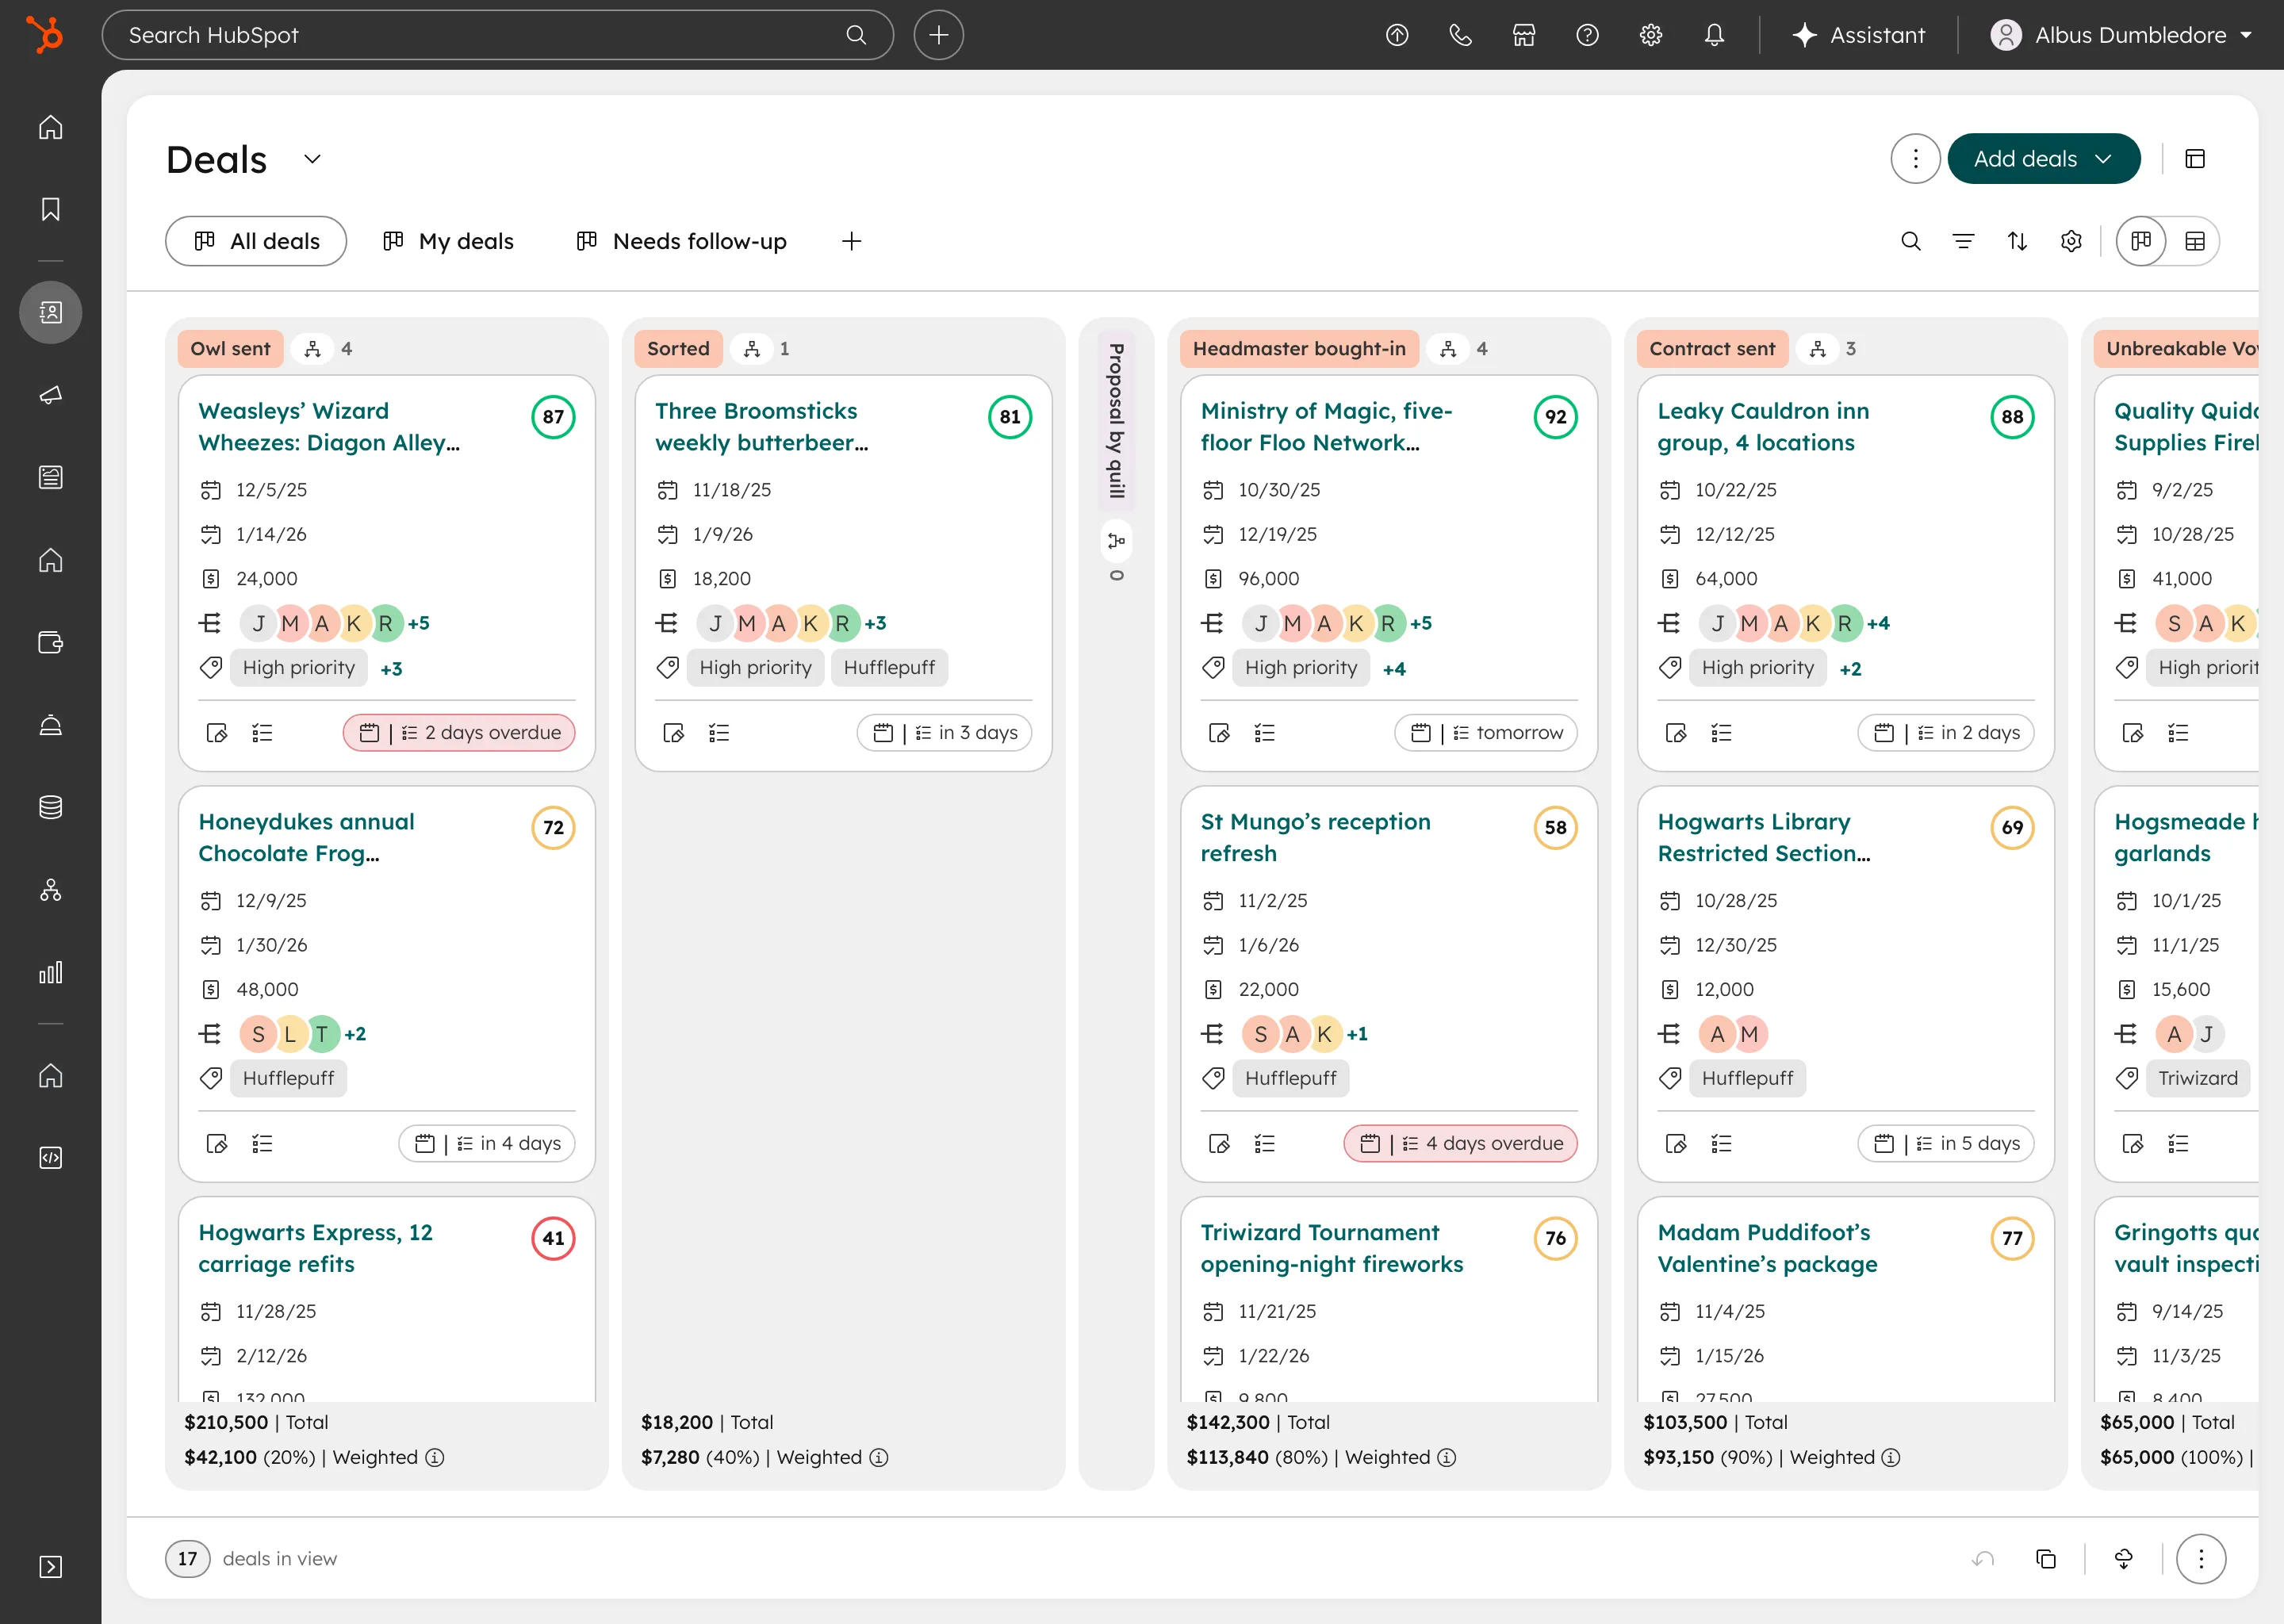
- Board Owned
- Deals
- Sales
- Sales Deal Progression
- Help Desk
- Tasks
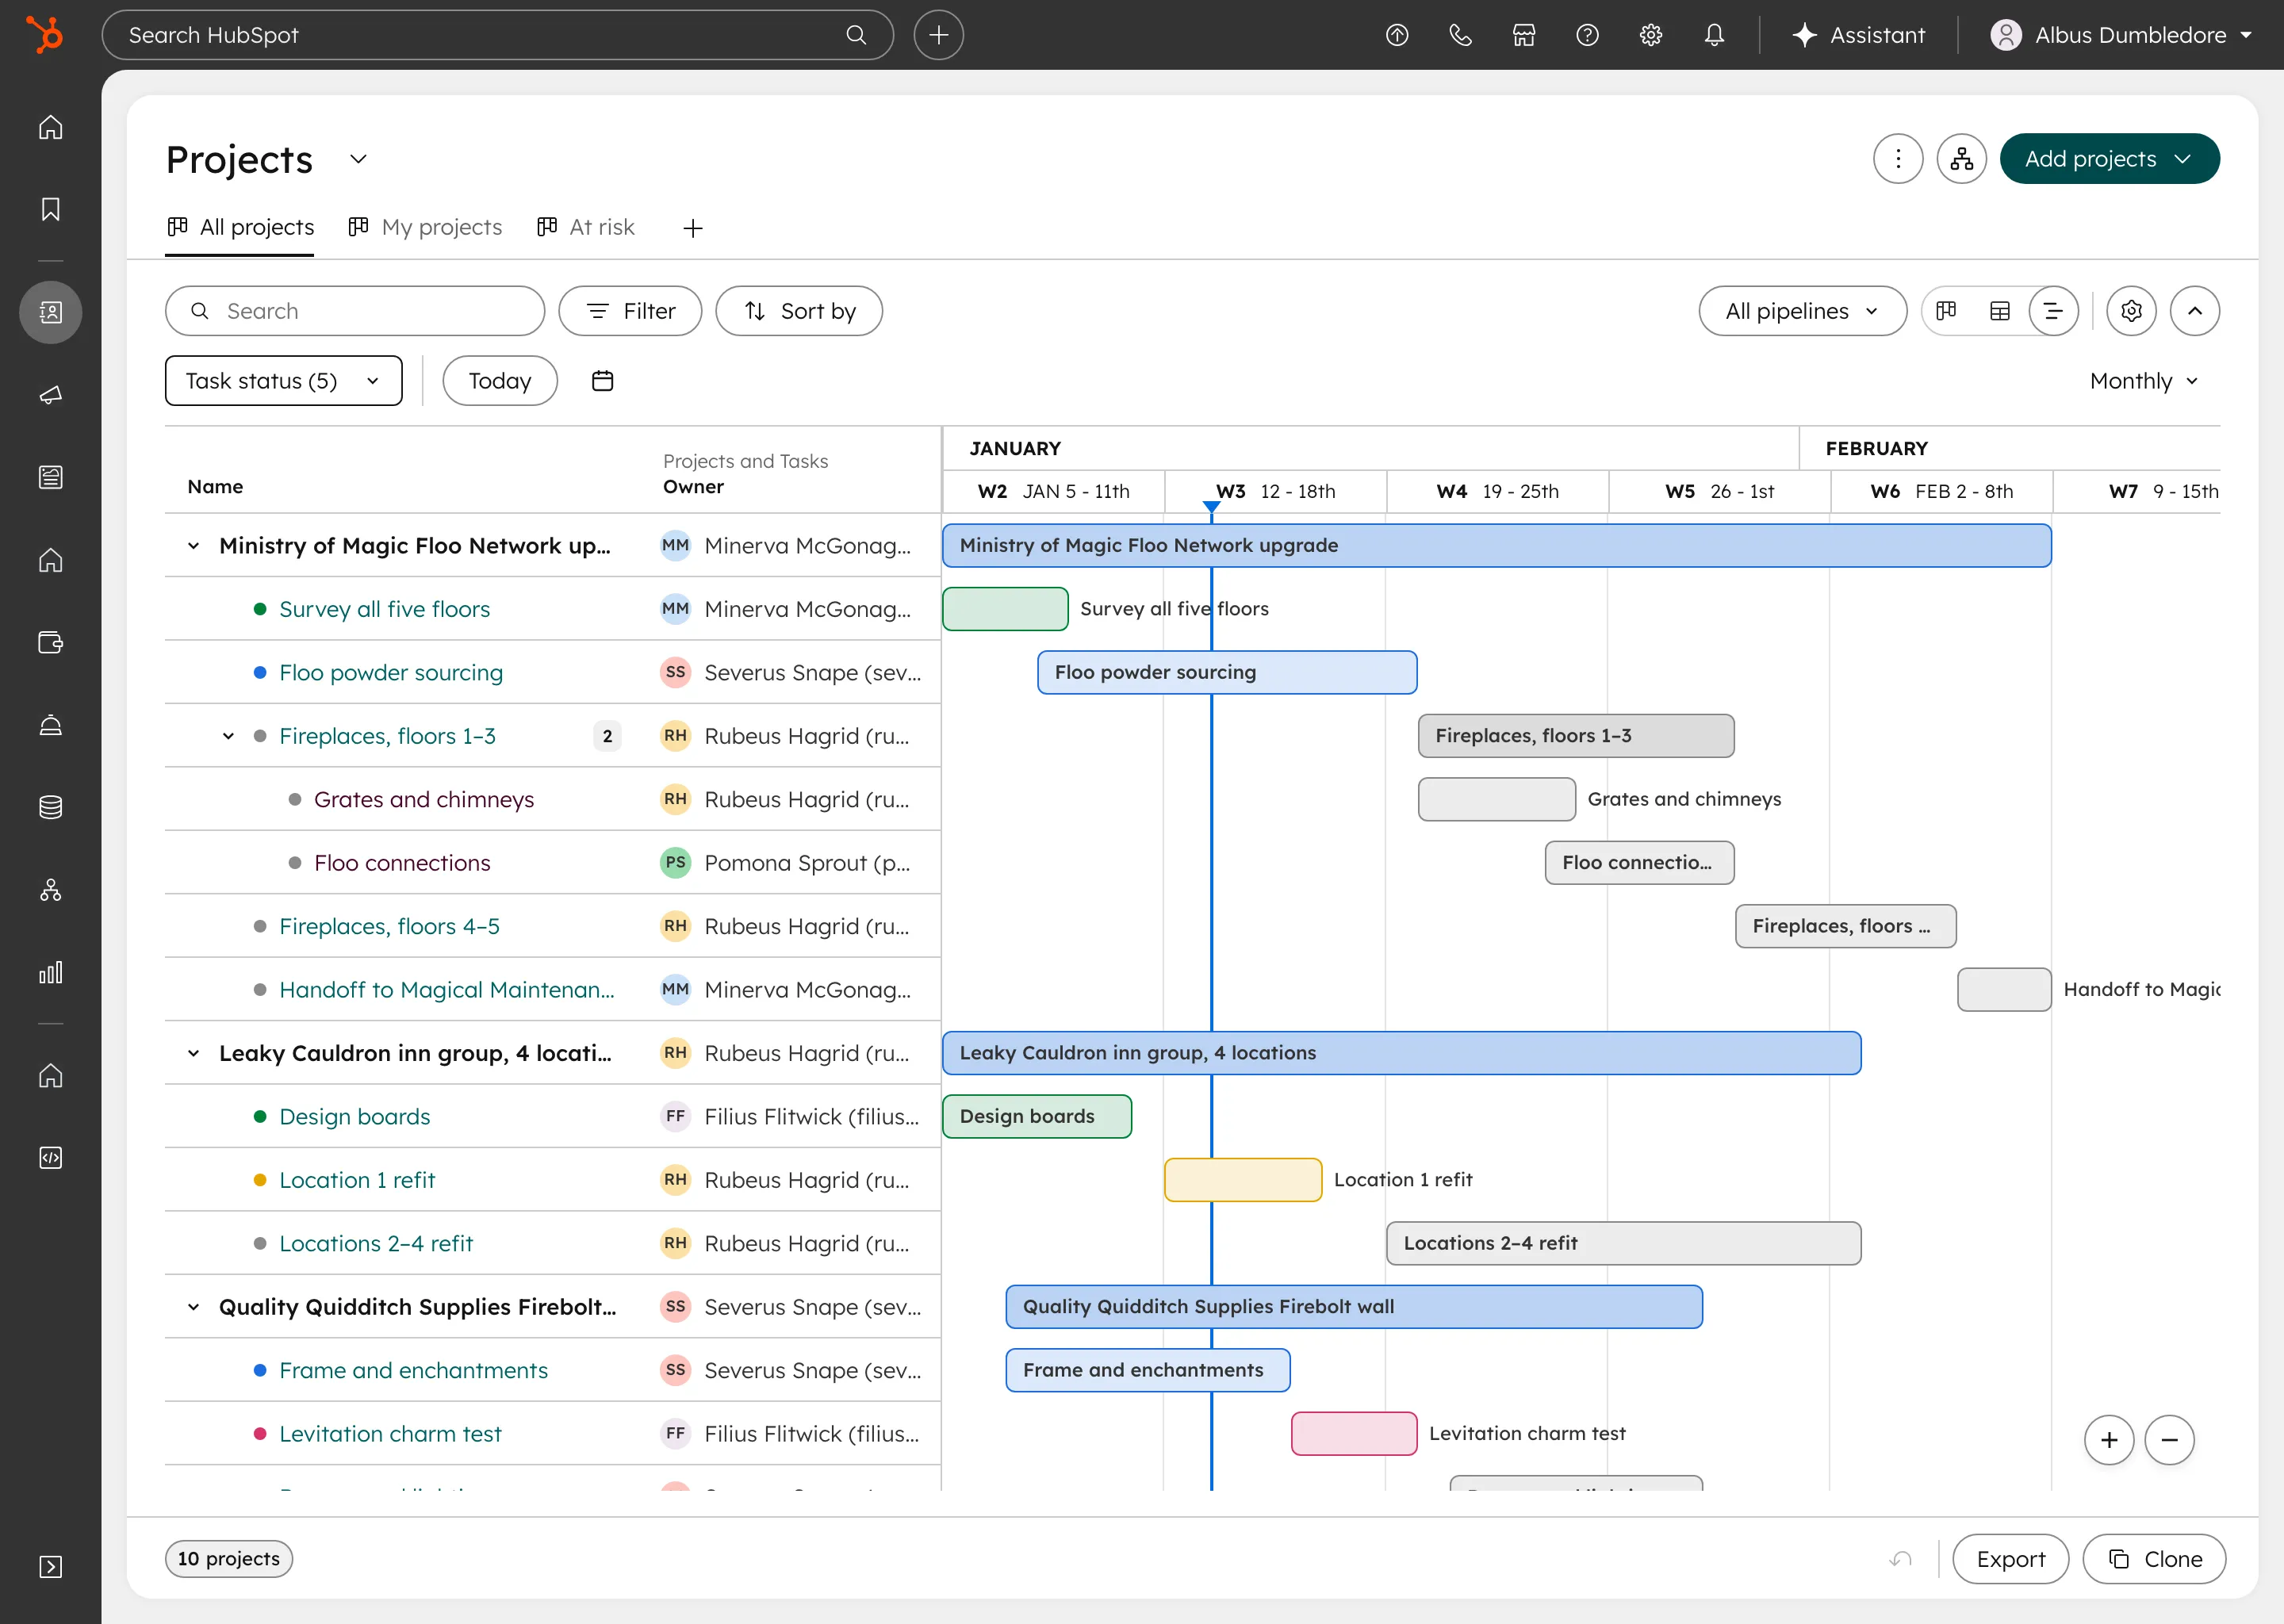
- Gantt Owned
- Deals
- Projects
- Tasks
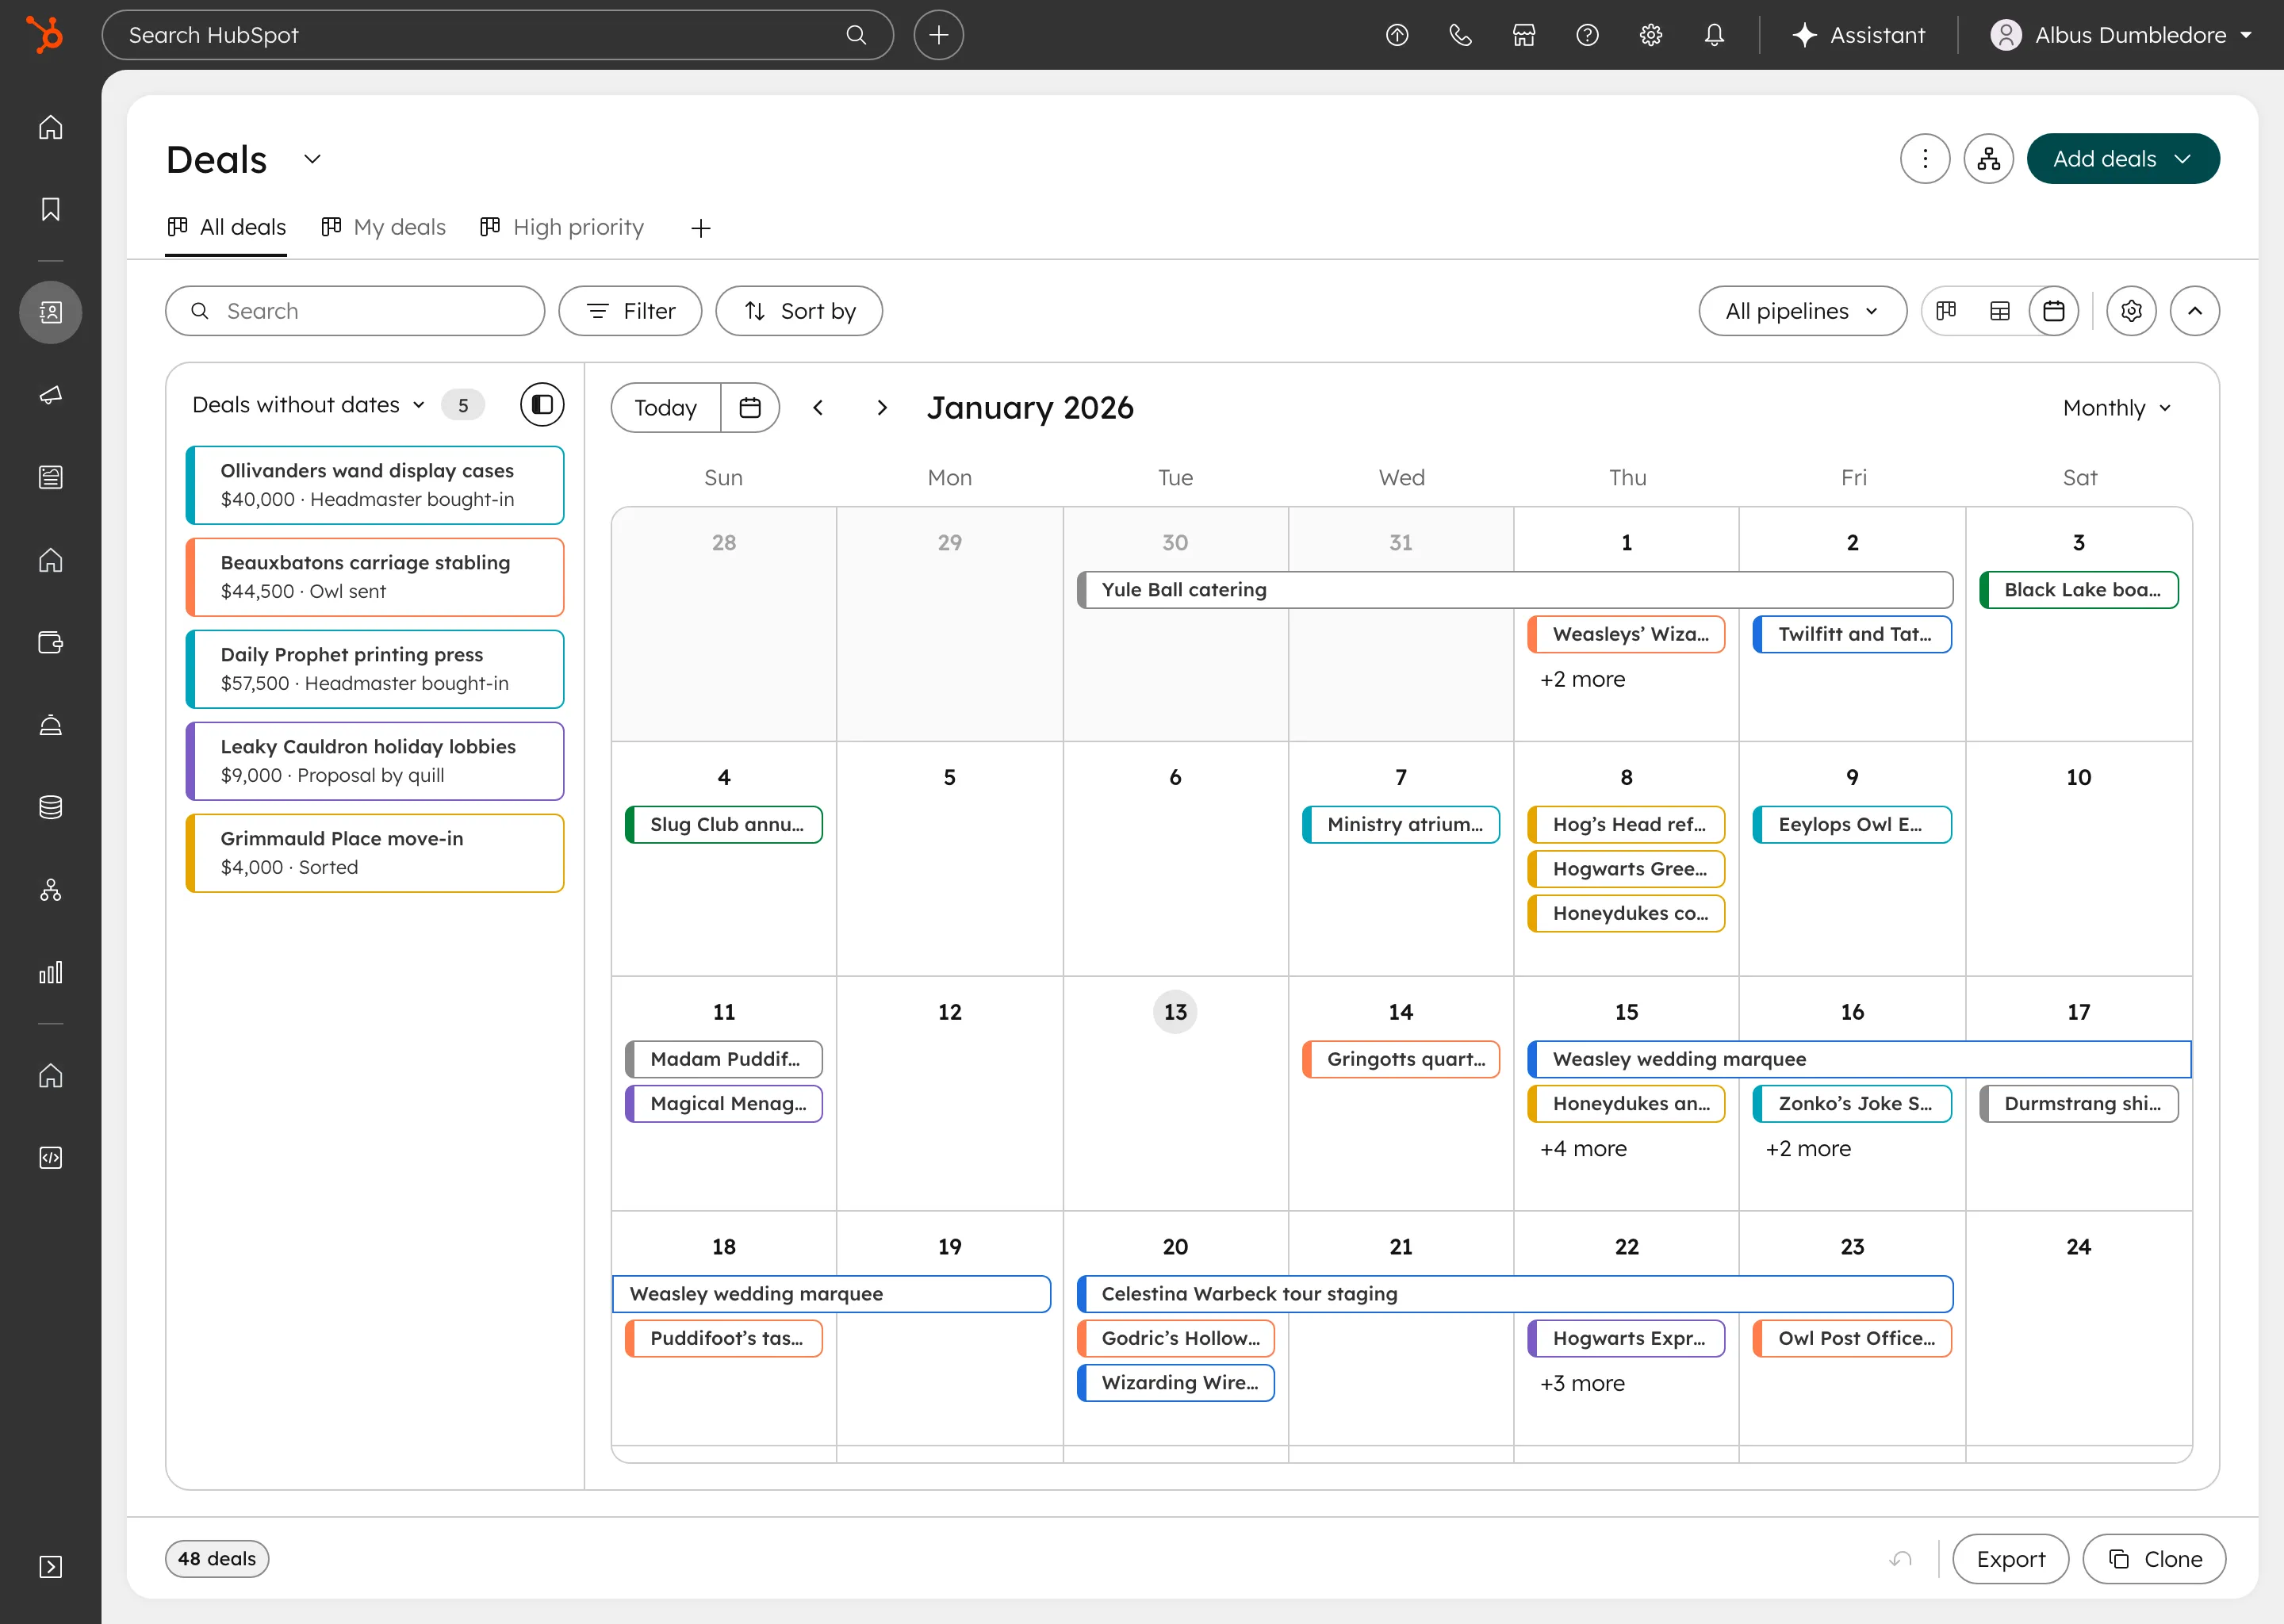
- Calendar Owned
- Deals
- Marketing Studio
- Tasks
- Table Influenced
- Nearly every team
- Map Influenced · beta
- Most other objects
My role
I was the senior product designer on the CRM Platform team responsible for HubSpot’s visualizations, working with my product manager and engineers, and partnering with designers on the product teams that relied on them, as well as the Design Systems team.
I owned the Board, Gantt and Calendar visualizations, and through the visualization framework I created, influenced the Table and Map visualizations (owned by another designer).
- 01 Researched Board’s pain points through feedback sessions and metrics
- 02 Hosted team brainstorms for competitive analysis and internal feedback
- 03 Defined the visualization framework on Board
- 04 Scaled it to Gantt and Calendar, and influenced Table and Map
- 05 Partnered with product teams on where to stay consistent and where to diverge
- 06 Worked with Design Systems to carry the changes into their redesign
Strategic approach
Designing the New Framework Using the Board
When I joined the CRM Platform team, my first project was to give the Kanban Board a vision that would ultimately modernize it and make it feel more like a platform (rather than just another page), while attending to the many paper cuts and customer complaints that created a subpar experience.
The Board was the #1 viewed page type on the platform, outpacing even our Table visualization that was a default view at HubSpot. Sales loved to change their preferences so that Board was the default view when they landed.
Because so many teams relied on Board, it had to work beyond my own team (Deals): for Help Desk, Sales, Marketing, and most other objects that used it as a default view. Its decisions also had to carry over to the other visualizations I’d be improving. So I used the Board redesign to build the framework for all of them.
Core problems
Defining Foundations through Problem Themes
My product manager and I sought to collect an exhaustive amount of feedback data and user research to properly understand just how behind we were in modernizing our Board experience. I also hosted brainstorm sessions with my direct team to run competitive analysis and gather internal feedback on Board.
Additionally, I worked with other teams’ designers to understand the problems they were facing in their own sections, and how I could help them solve some of the issues with our framework and improvements. Most of the problems we heard traced back to a handful of principles, and those principles became the framework.
Research methods
- User feedback sessions
- Team brainstorm sessions
- Competitive analysis
- Metrics data
- Coordination with other teams
The framework
- Keep users in work mode: Customers prefer to stay in the visualizations unless they need to go into “research mode.”
- Interaction should guide the flow: Customers are busy. Visualization interactions should guide, delight and save users time.
- Mind the data density: Customers want to see more data, and the visualization finds a way to show it thoughtfully.
- Best defaults, user control: Give our best defaults, but let people adjust them if they wish.
I put the principles to work across five problem themes from our research, each of which extended to the other visualizations. I developed the initial solutions on Board, pressure tested them with the other visualizations to make sure they held up at their base level, and worked with my team to prioritize the rollout.
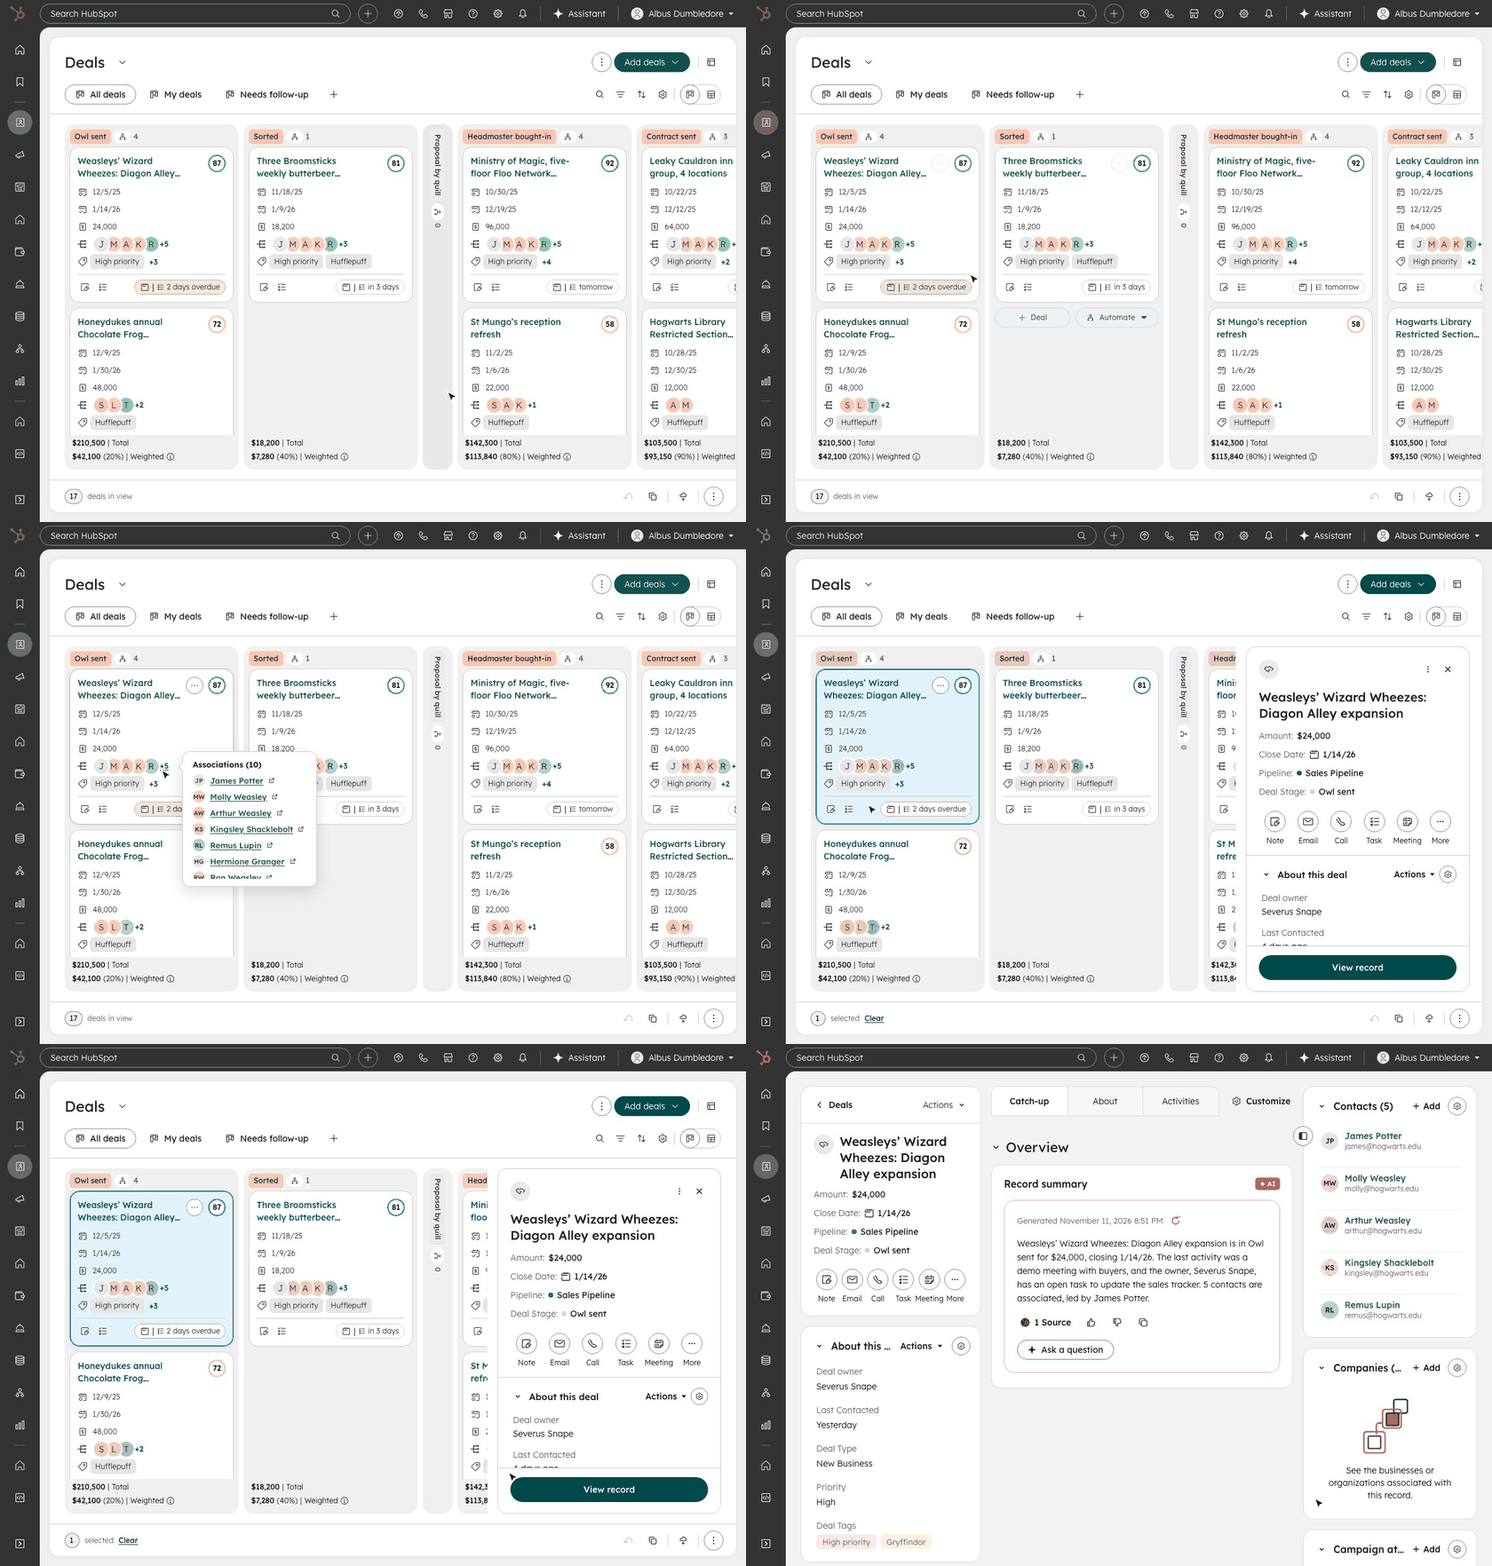
Interaction Patterns
- Problem
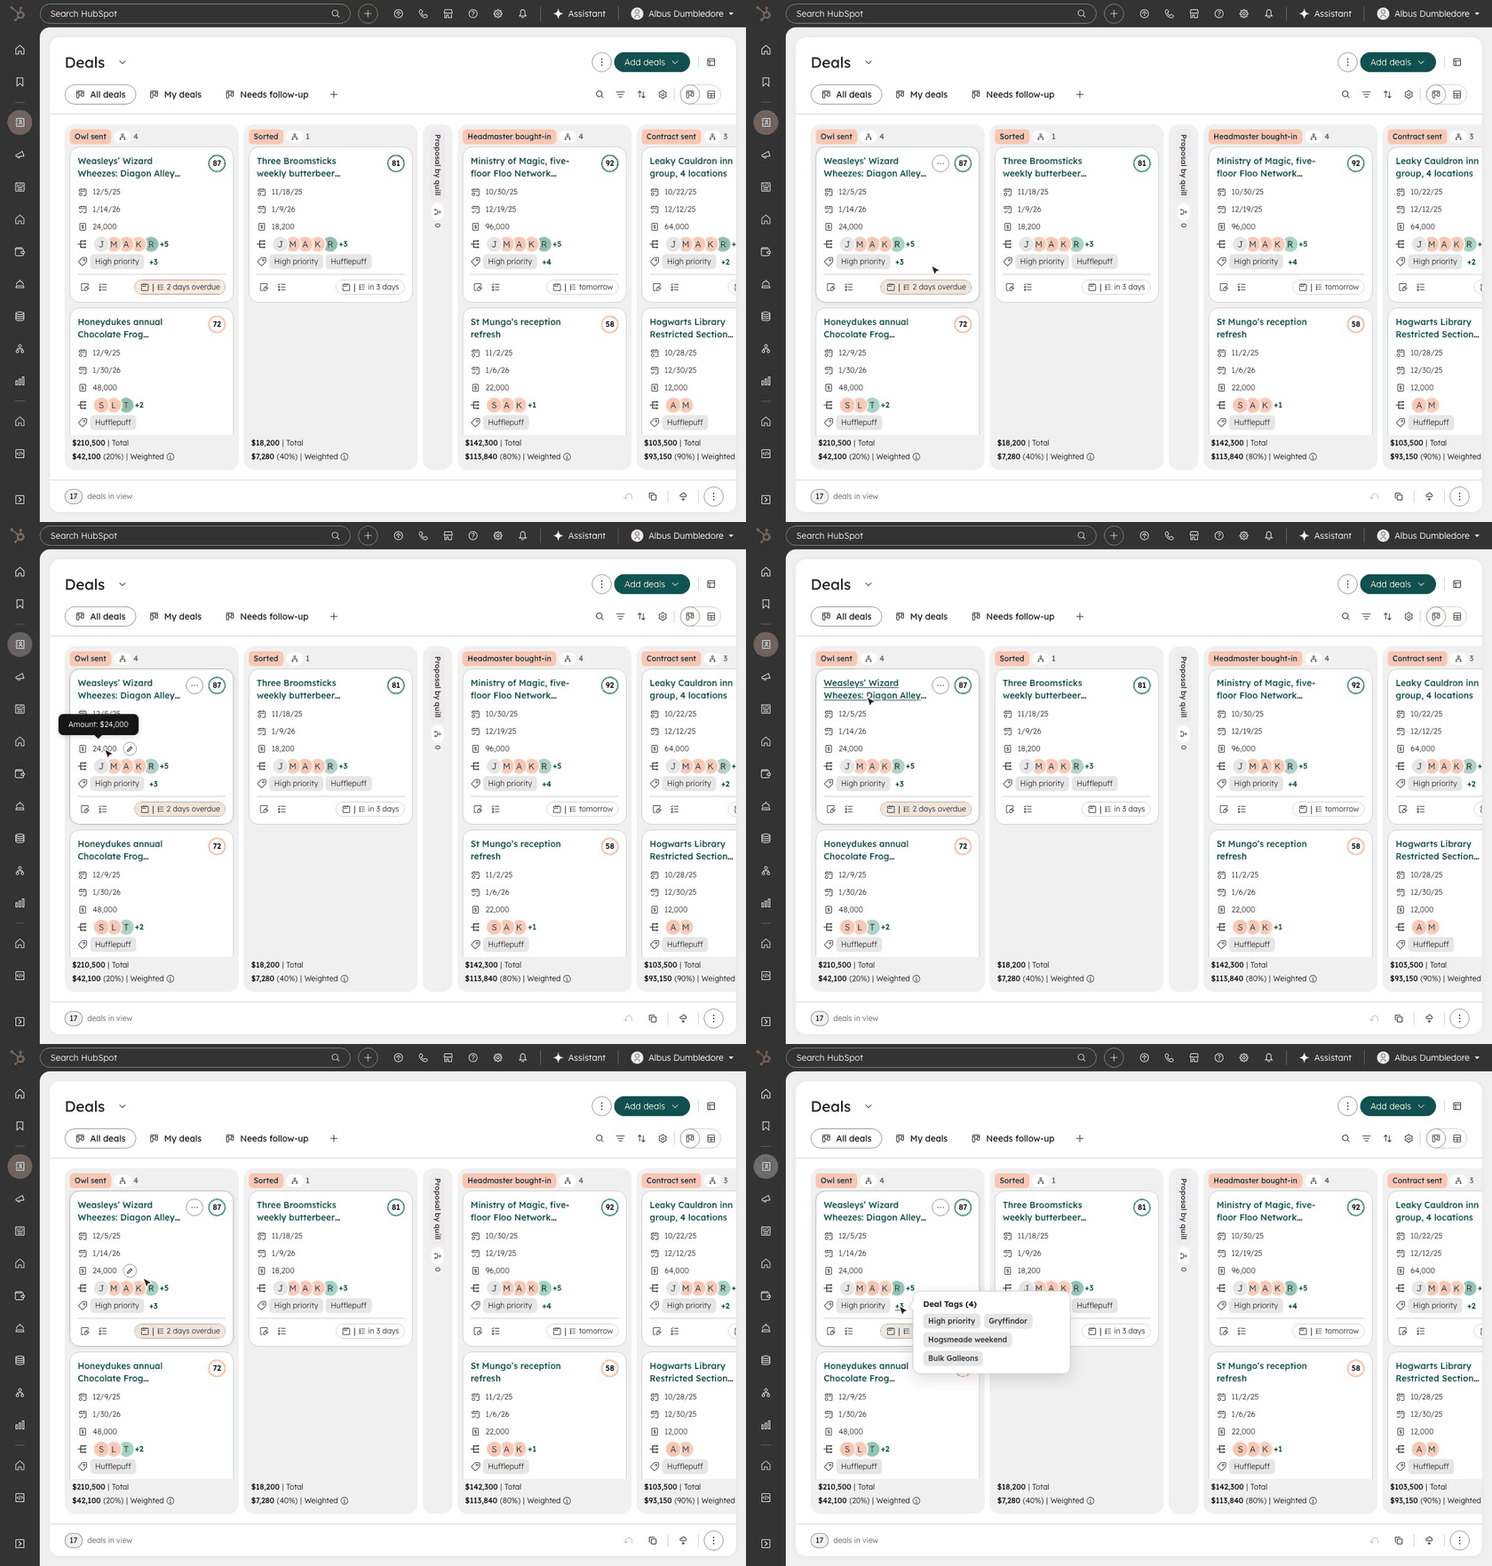
- Getting from a visualization to a record was inconsistent, so people opened record after record in new tabs, even when they only needed a quick look.
- Solution
- Progressive disclosure: a peek at core details on the card, a preview in place, and the record page only when someone needs to dig in. Keep users in their work.
Readability
- Problem
- Long text truncated and dense data was hard to scan. Users constantly complained about not being able to see large lengths of text easily.
- Solution
- Base rules for overflow, spacing and sizing, tuned with the design systems team for data-dense views, with tooltips and popovers for what still doesn’t fit.
Settings
- Problem
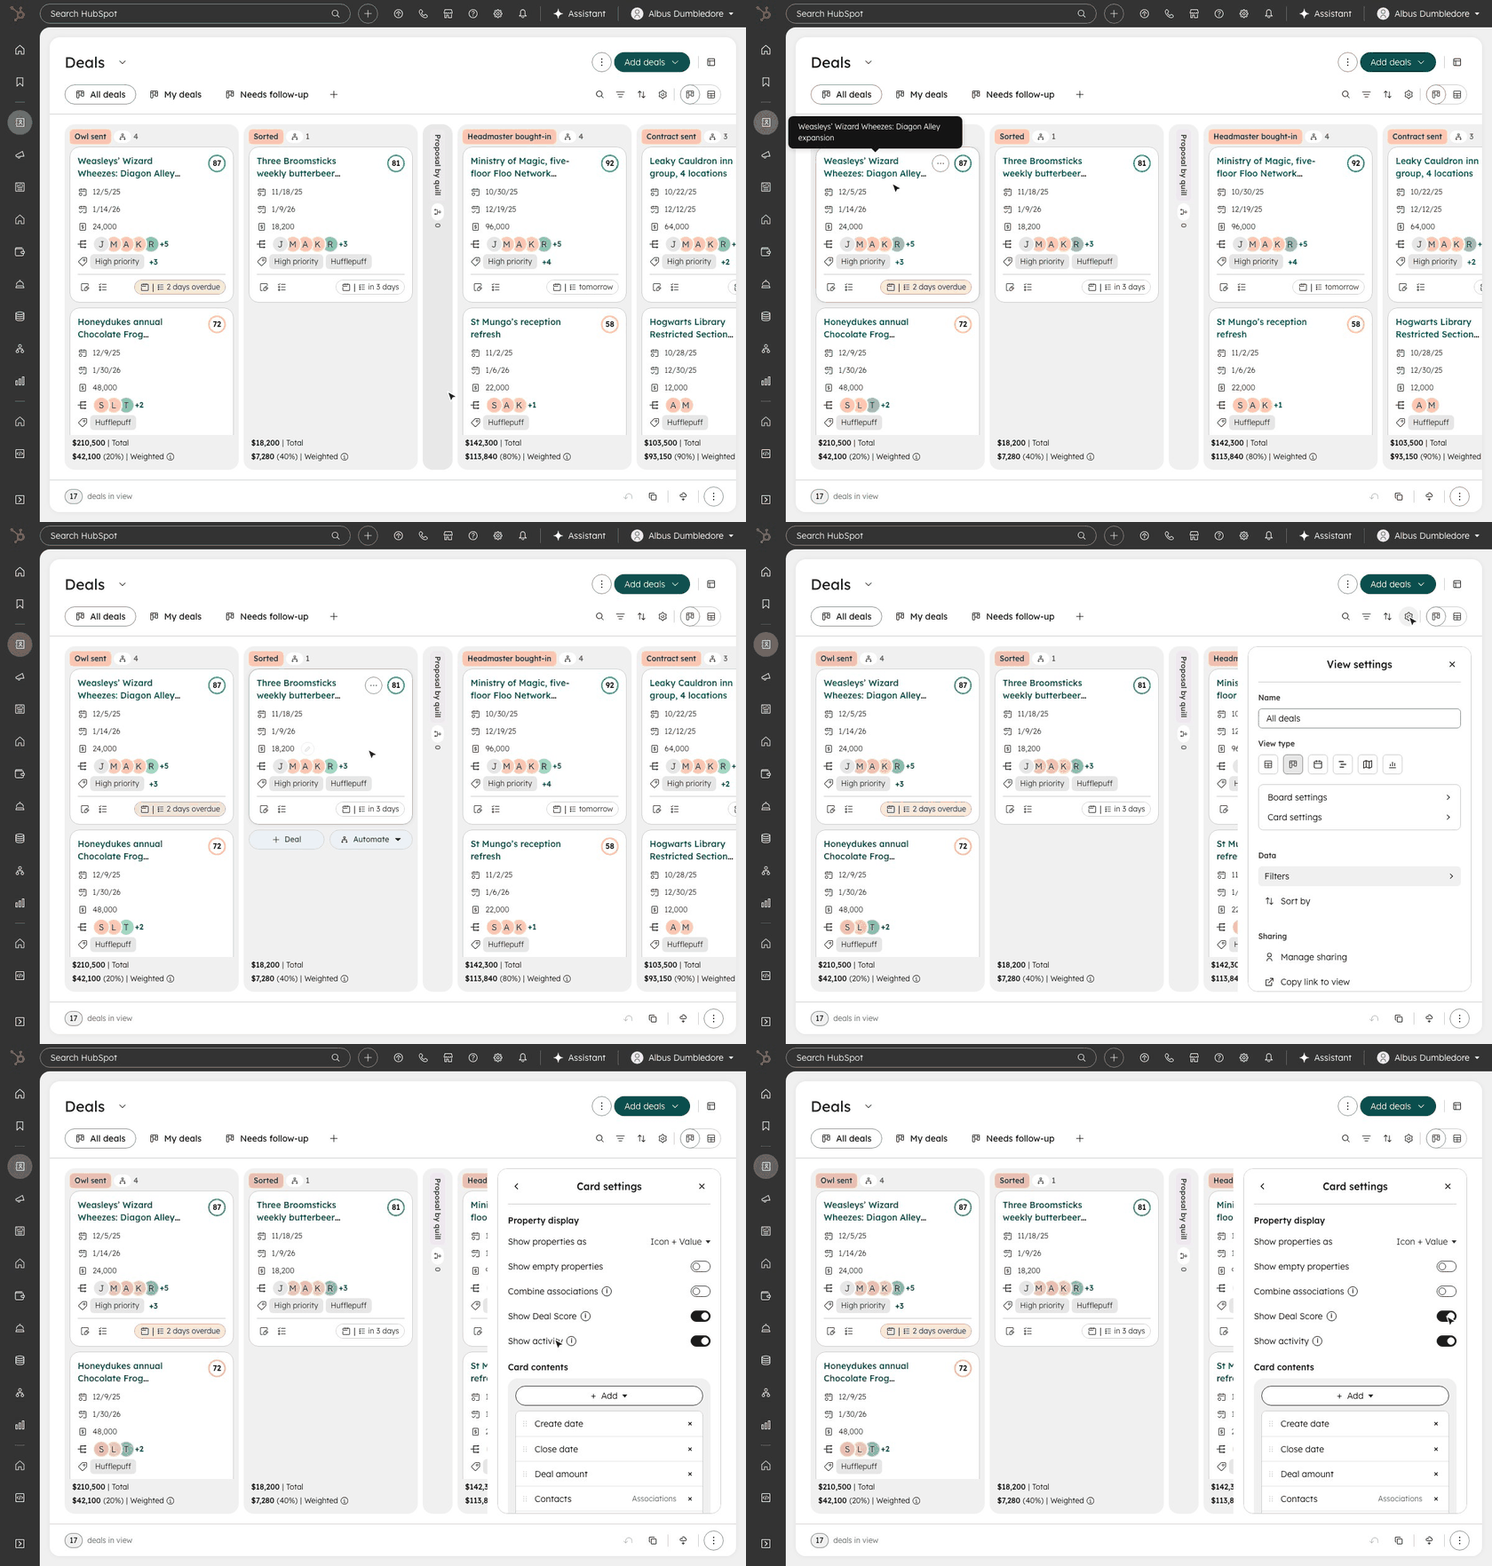
- Settings were edited on a simulated board, away from the real one, and it wasn’t clear what changed the whole visualization and what changed one part. Gantt and Calendar also didn’t have any settings experiences.
- Solution
- A clear split between managing the sum and its parts, live previews of your real board, and location based context menus for quick, localized adjustments.
Color
- Problem
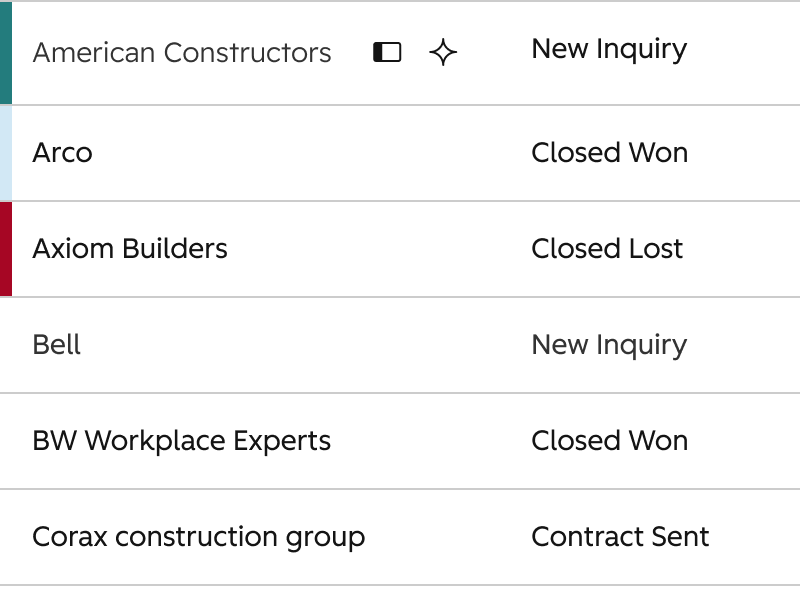
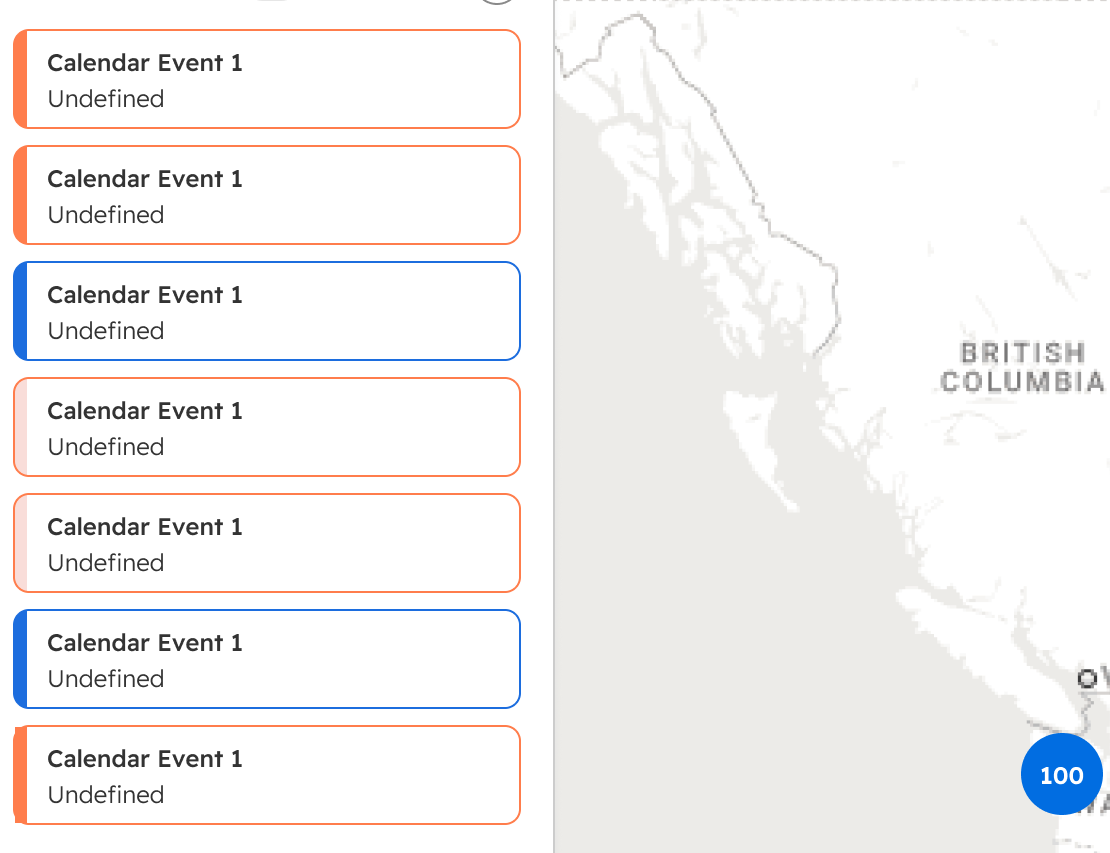
- People wanted color, but it came from different places, set by property values and by people themselves, with no rules for which wins.
- Solution
- A hierarchy between property-level treatments and the color people apply themselves, and how each shows up in every visualization.
Interaction States
- Problem
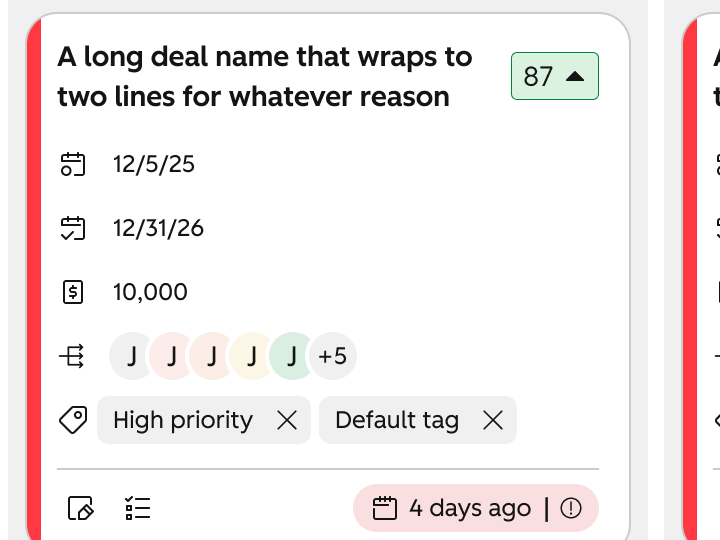
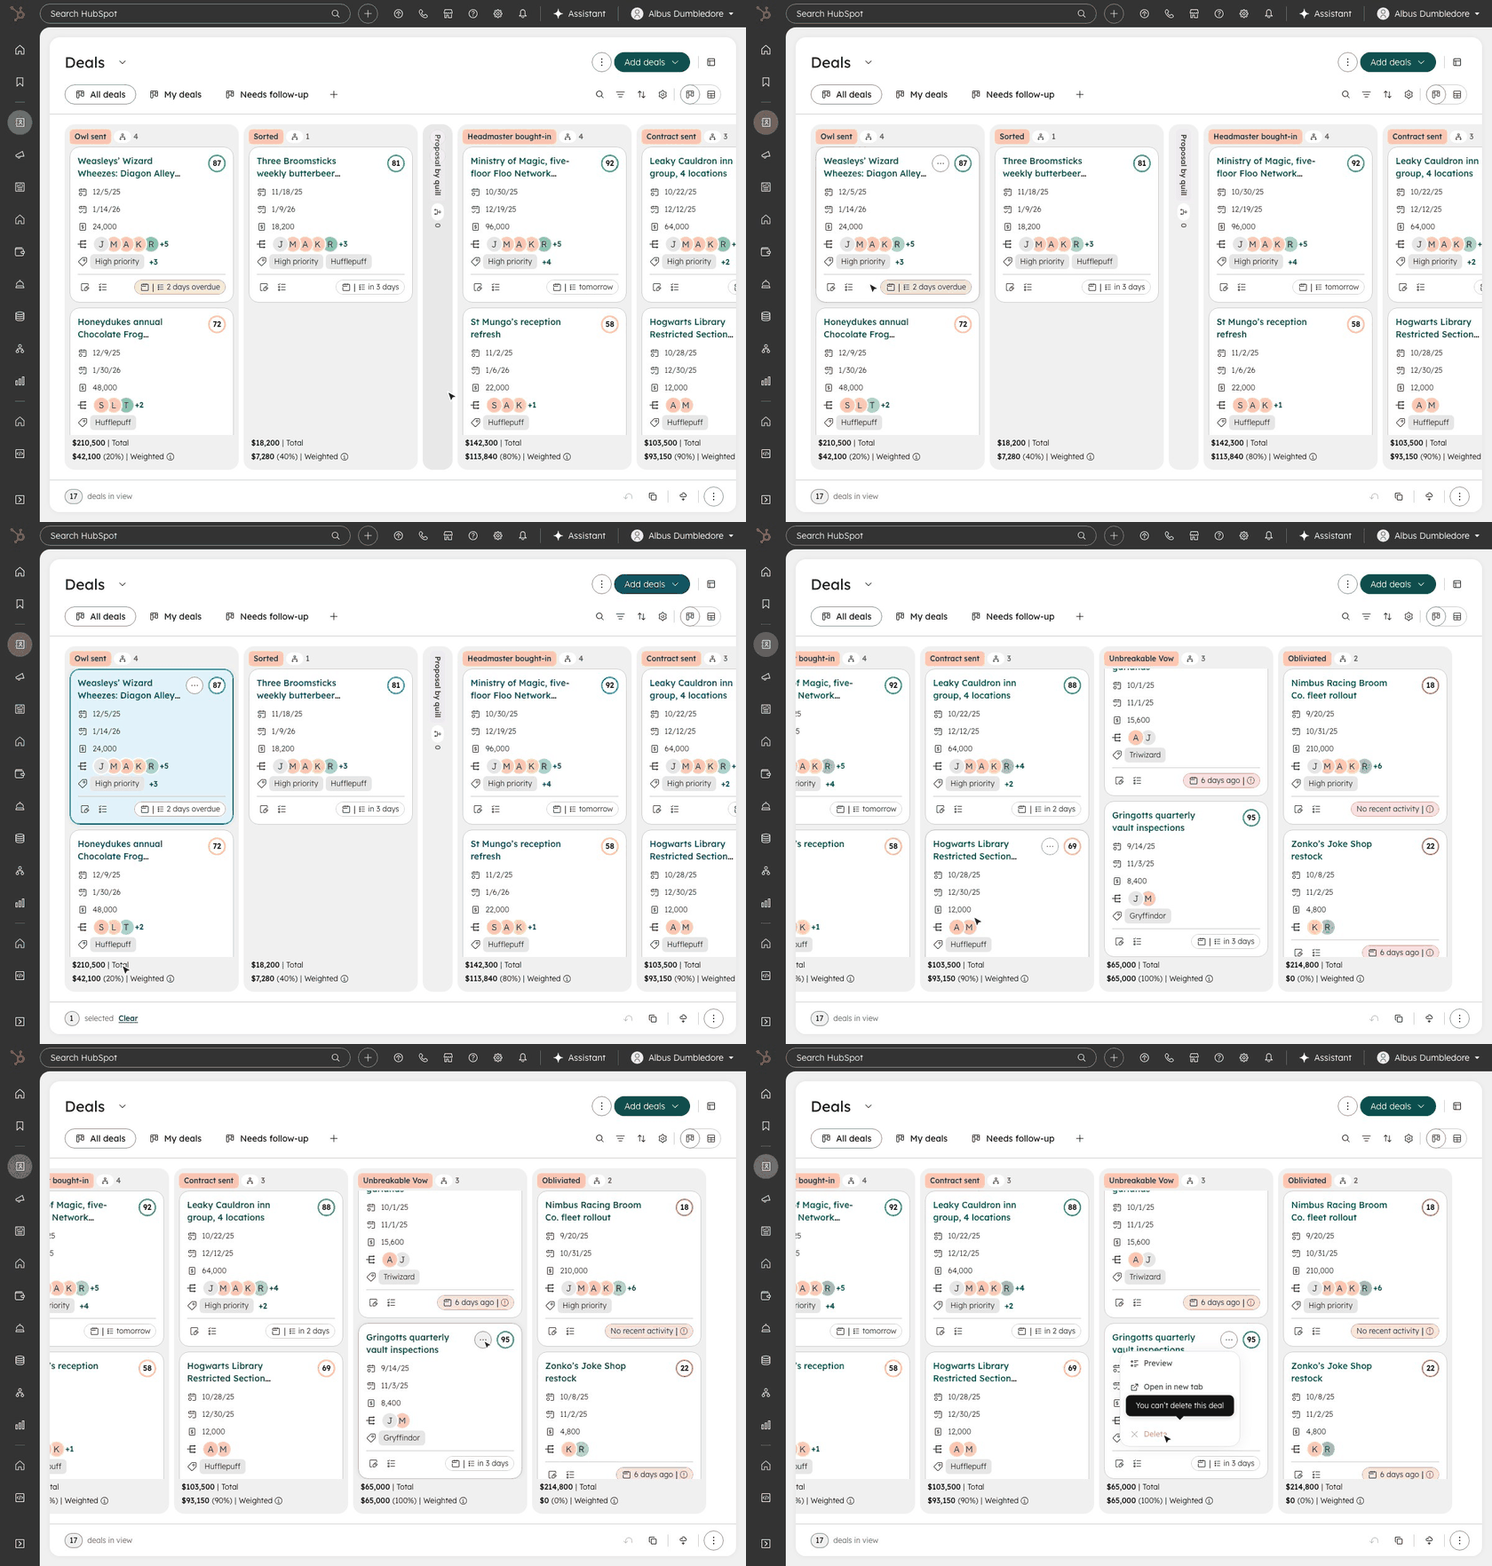
- Users complained about Board’s inconsistency and difficulty with seeing various interaction states (especially disabled and selected states).
- Solution
- Because these patterns weren’t yet defined by the Design Systems team, I used the foundations to define the suite of interaction states for all visualizations.
Bonus: Introducing Activity Chips
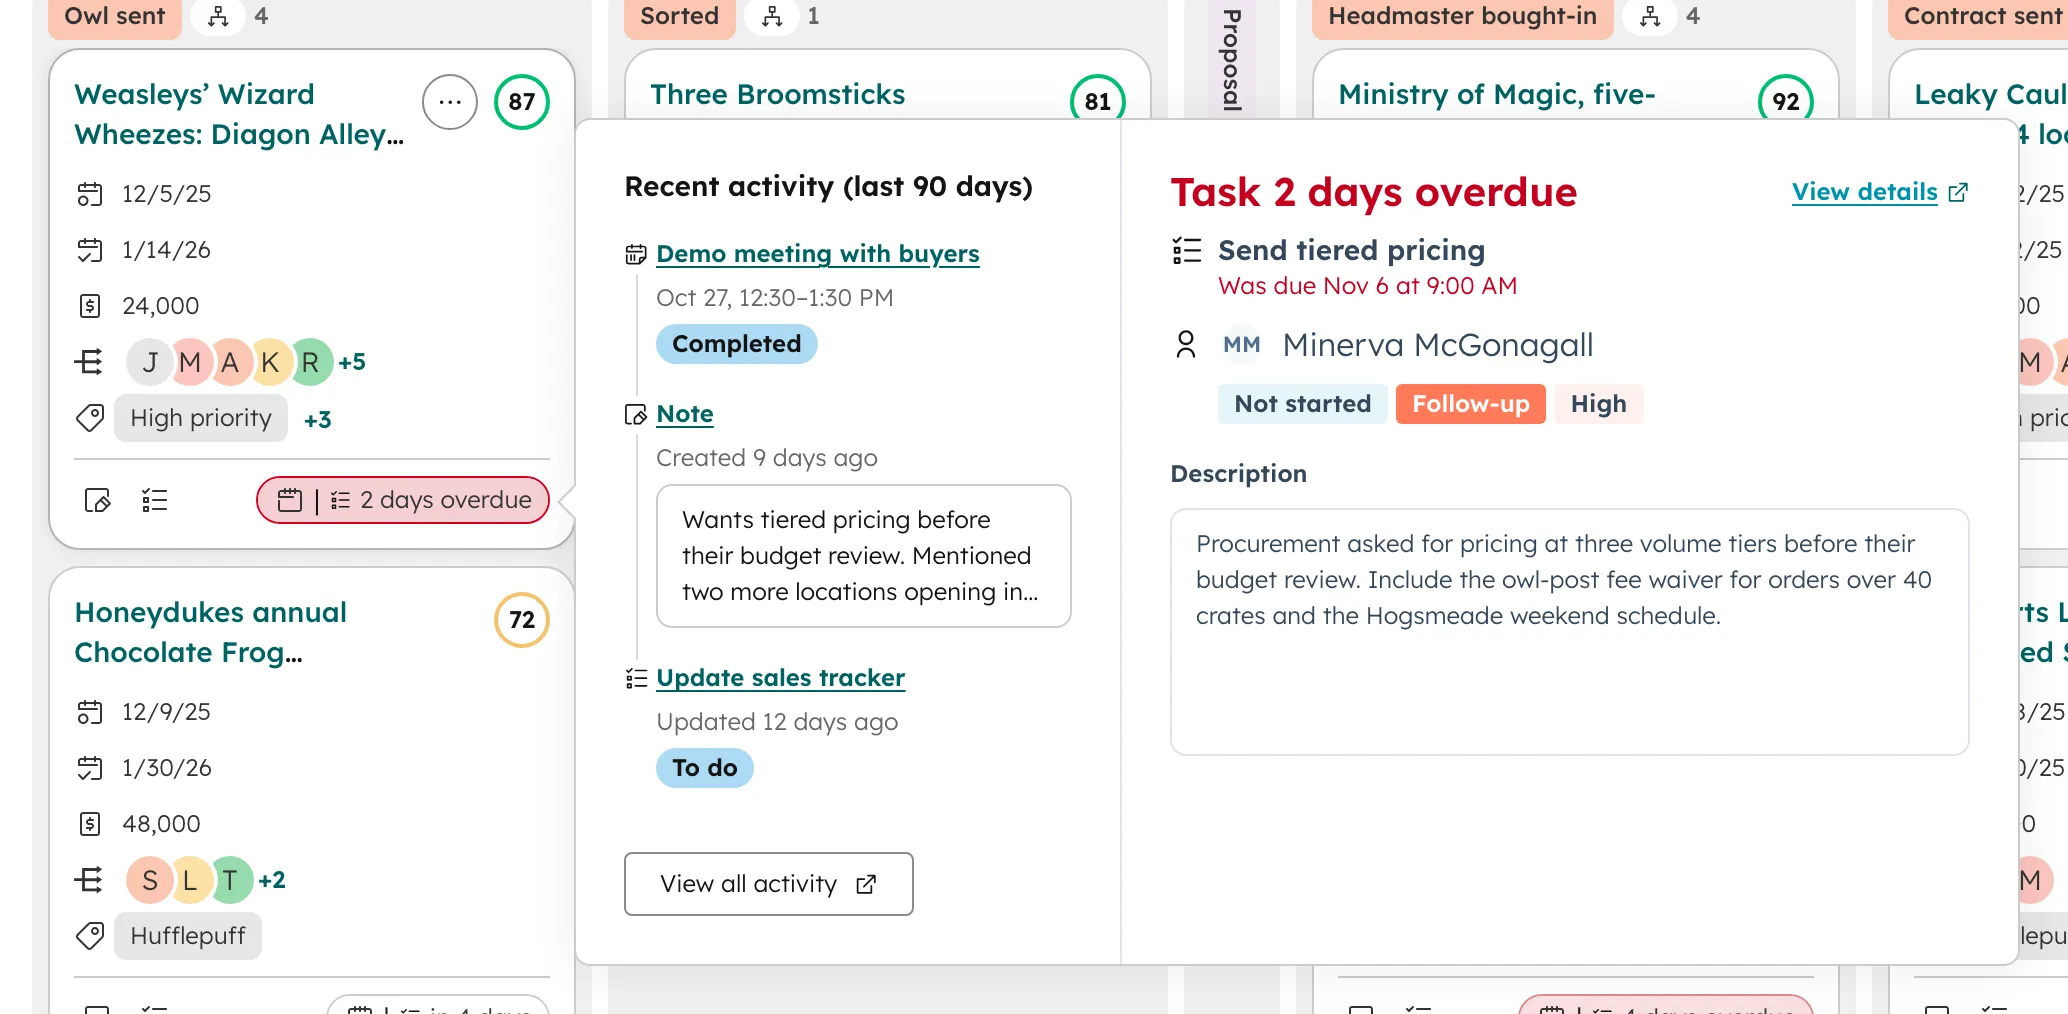
Our research turned up a hidden gem: almost every person we asked was working too manually to understand what they needed to do to move their Deals forward, and that insight became a new feature. My vision was an overview at the top of the board, but we couldn’t justify the lift for a feature that size, so I scoped it down to an Activity Chip at the bottom of each card that summarized a user’s recent activity and what was upcoming or overdue. A user could hover and glean a brief update on that Deal, reducing the time it took to gain that context.
Redesigns
Carrying the Framework into Board, Gantt and Calendar
Key improvements
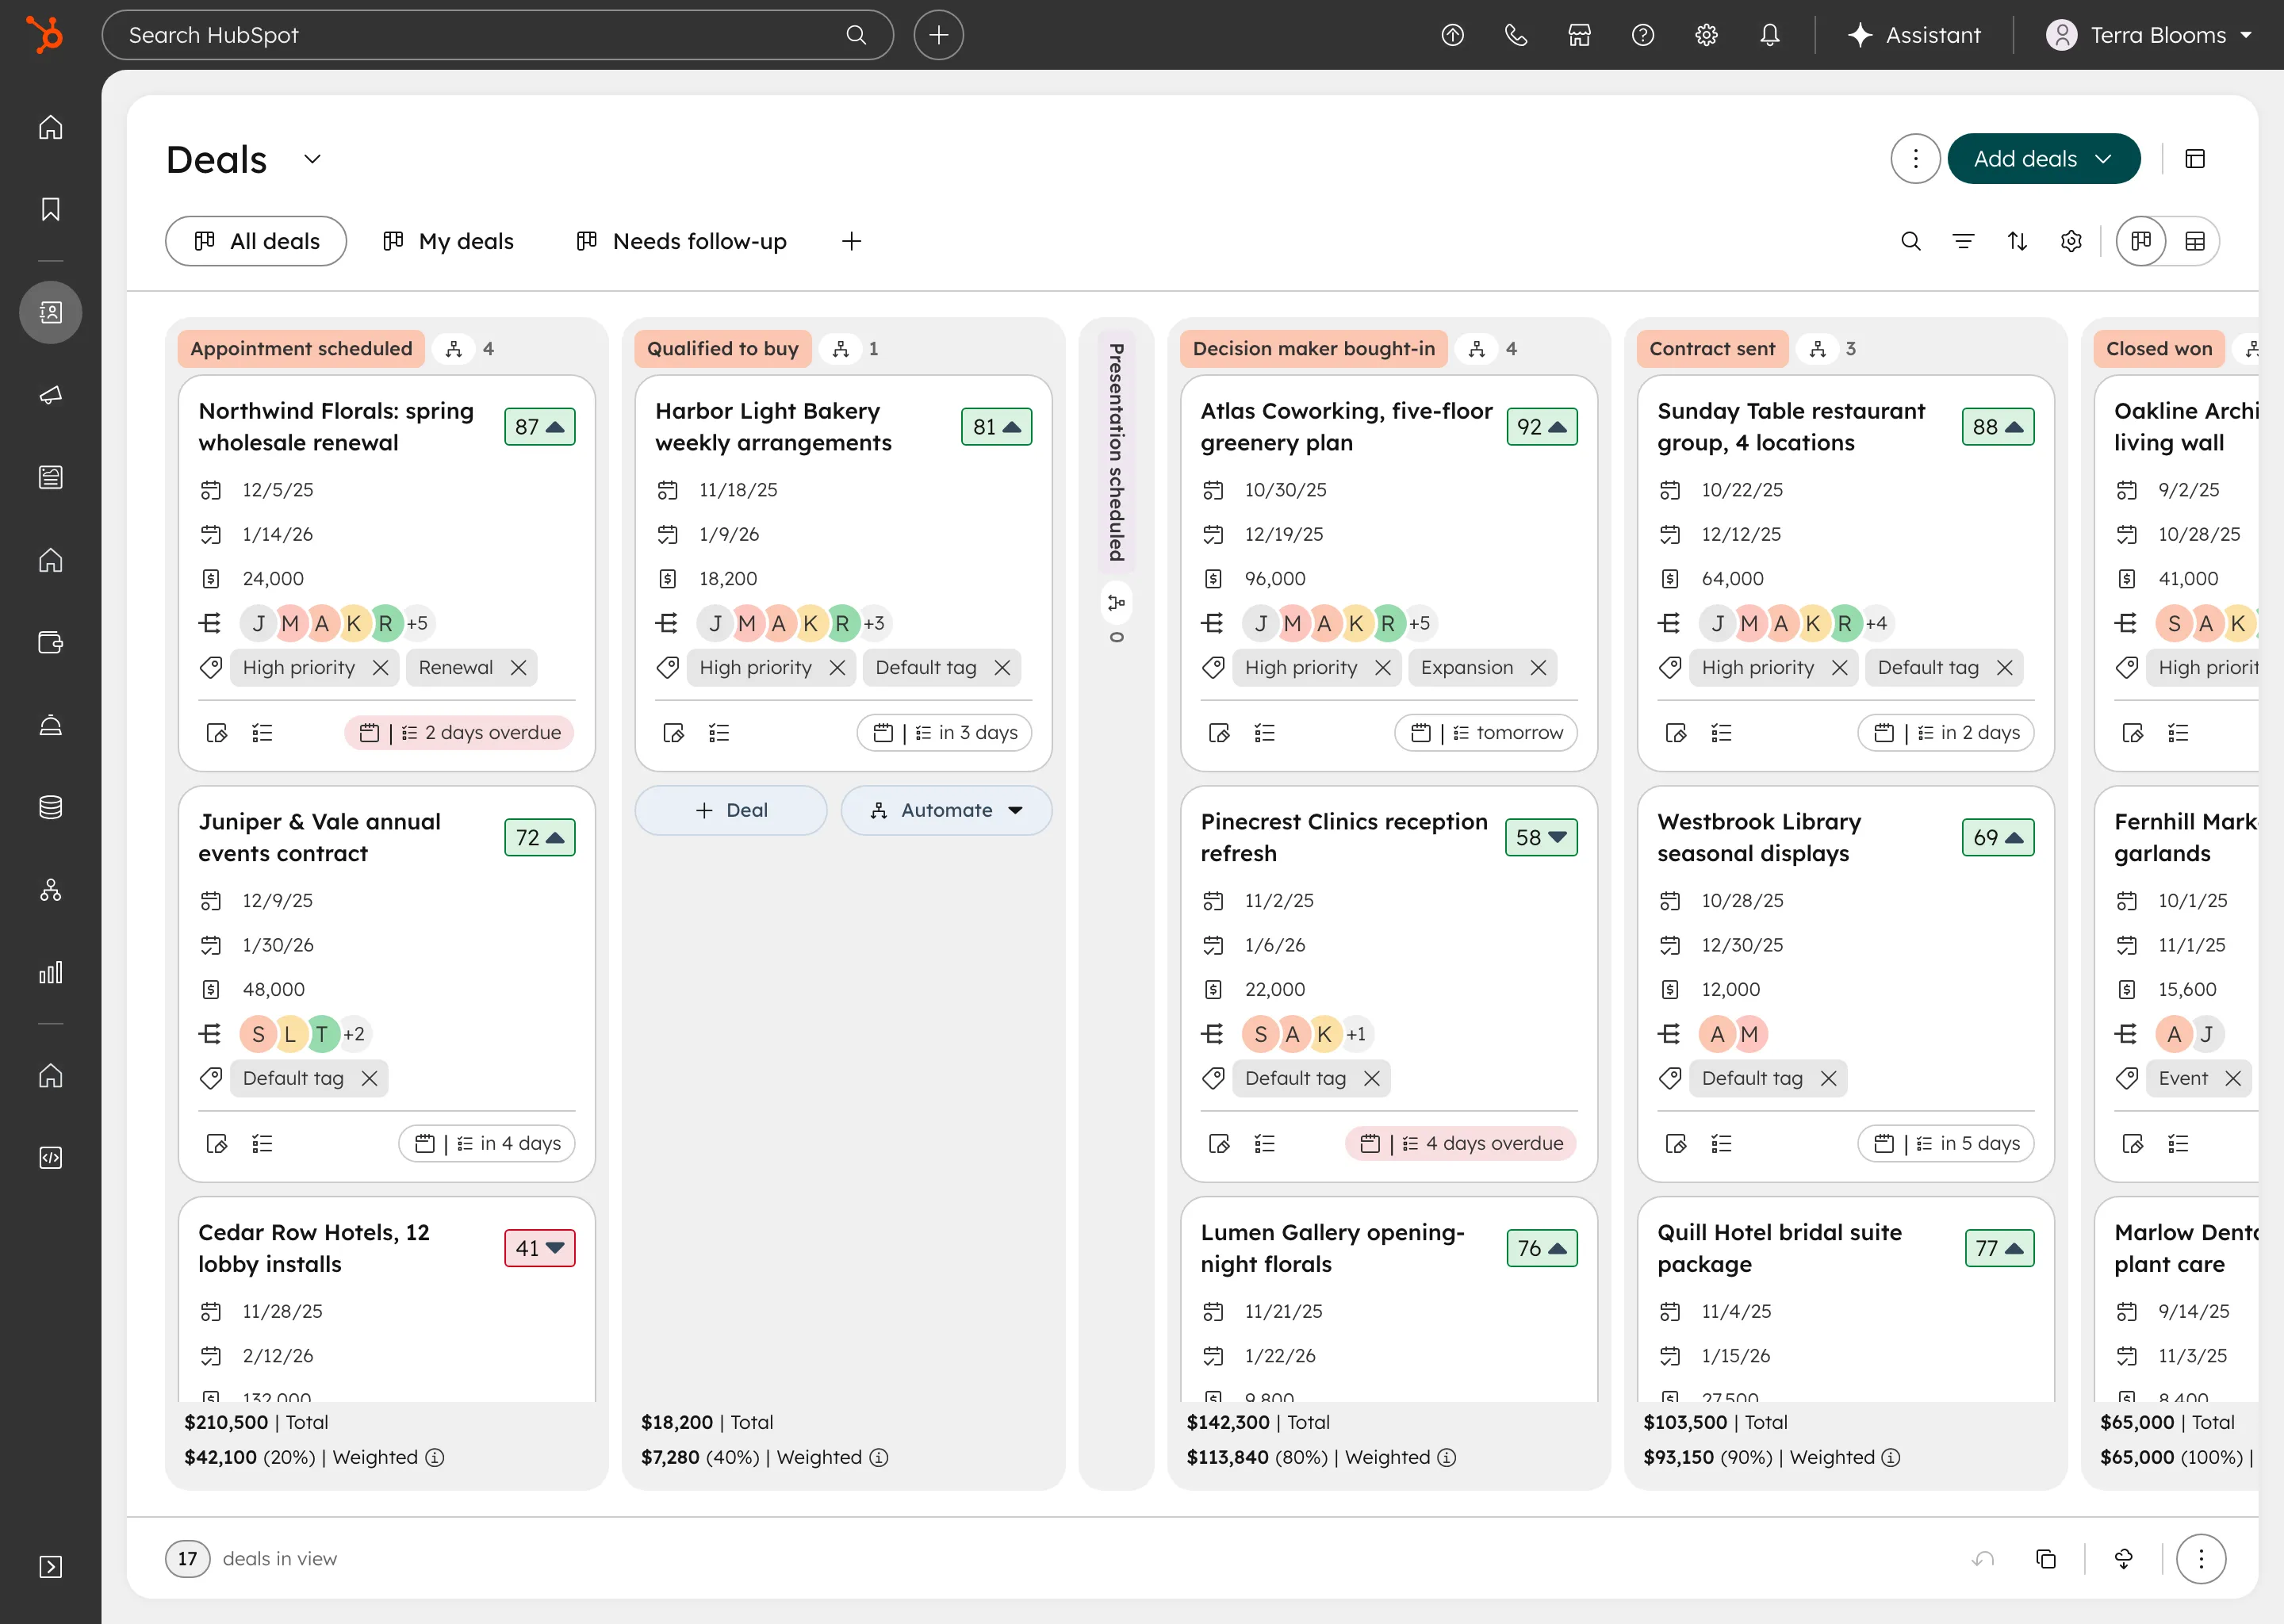
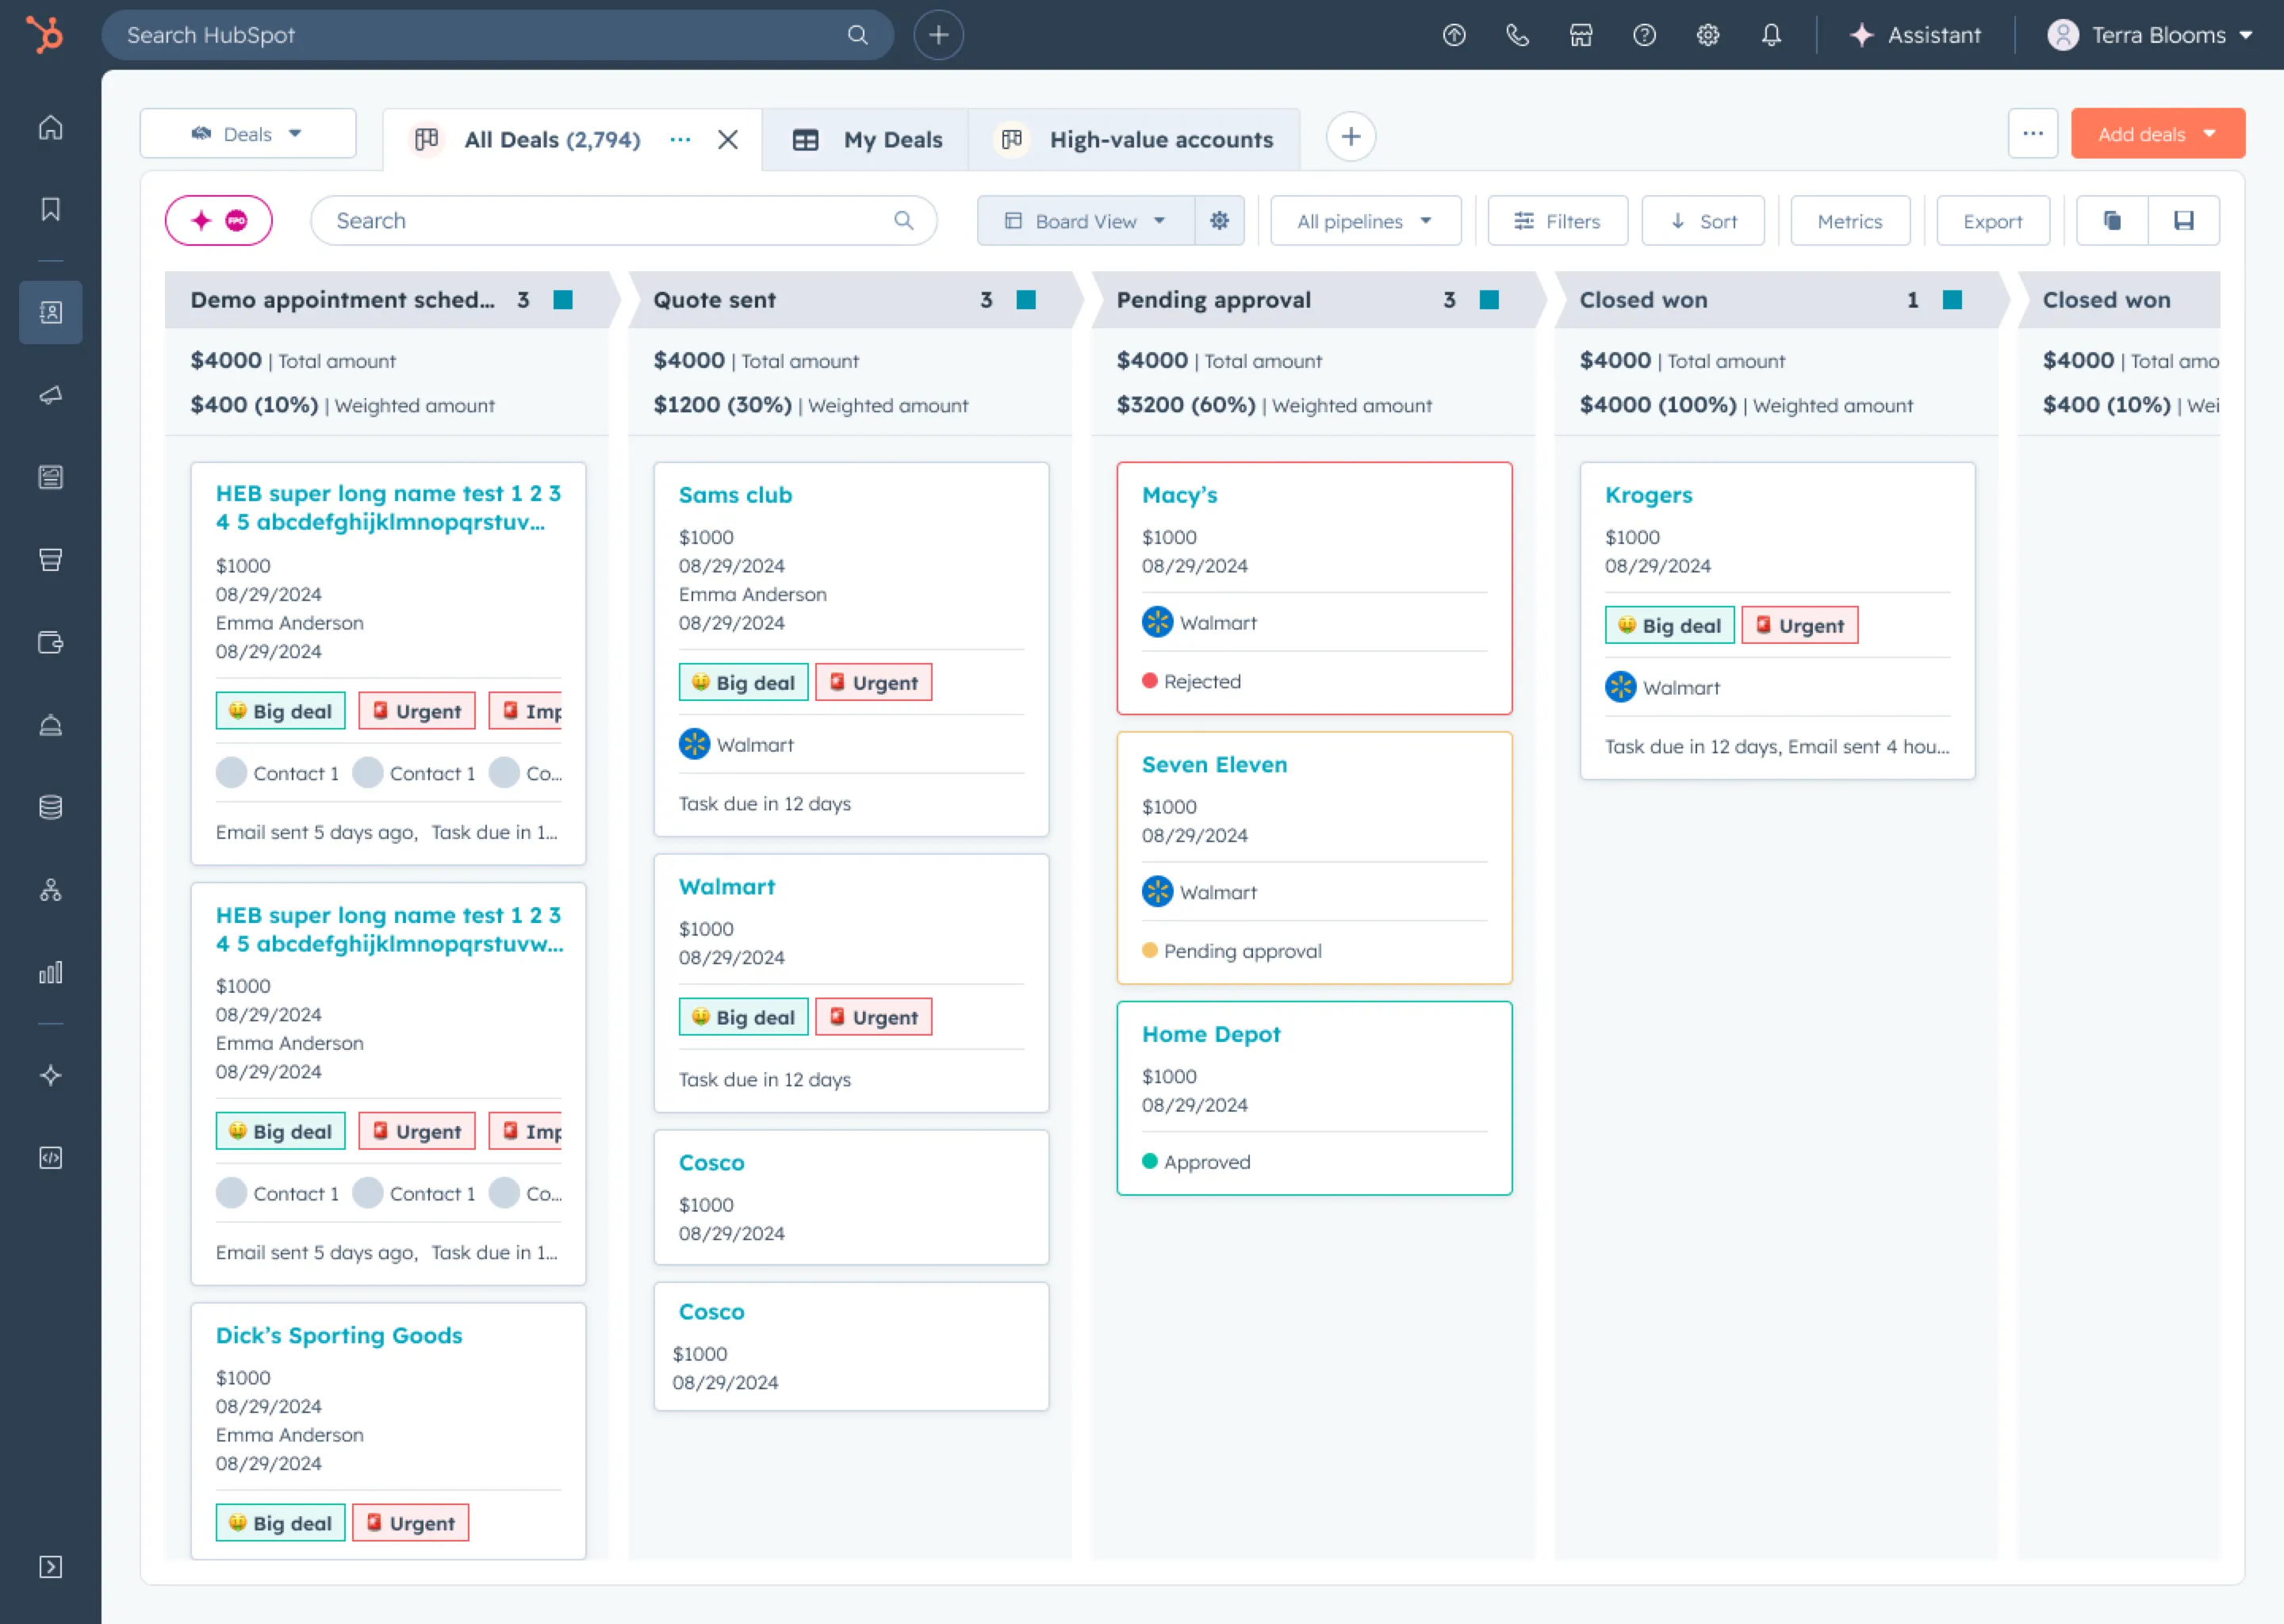
- Peek, preview, page progressive disclosure patterns
- Introduced activity chips to see what’s been done and what’s upcoming
- Standardized property inputs, values and tooltips
- Added context menu settings on lanes and cards
- Made settings live-updating and more cohesive
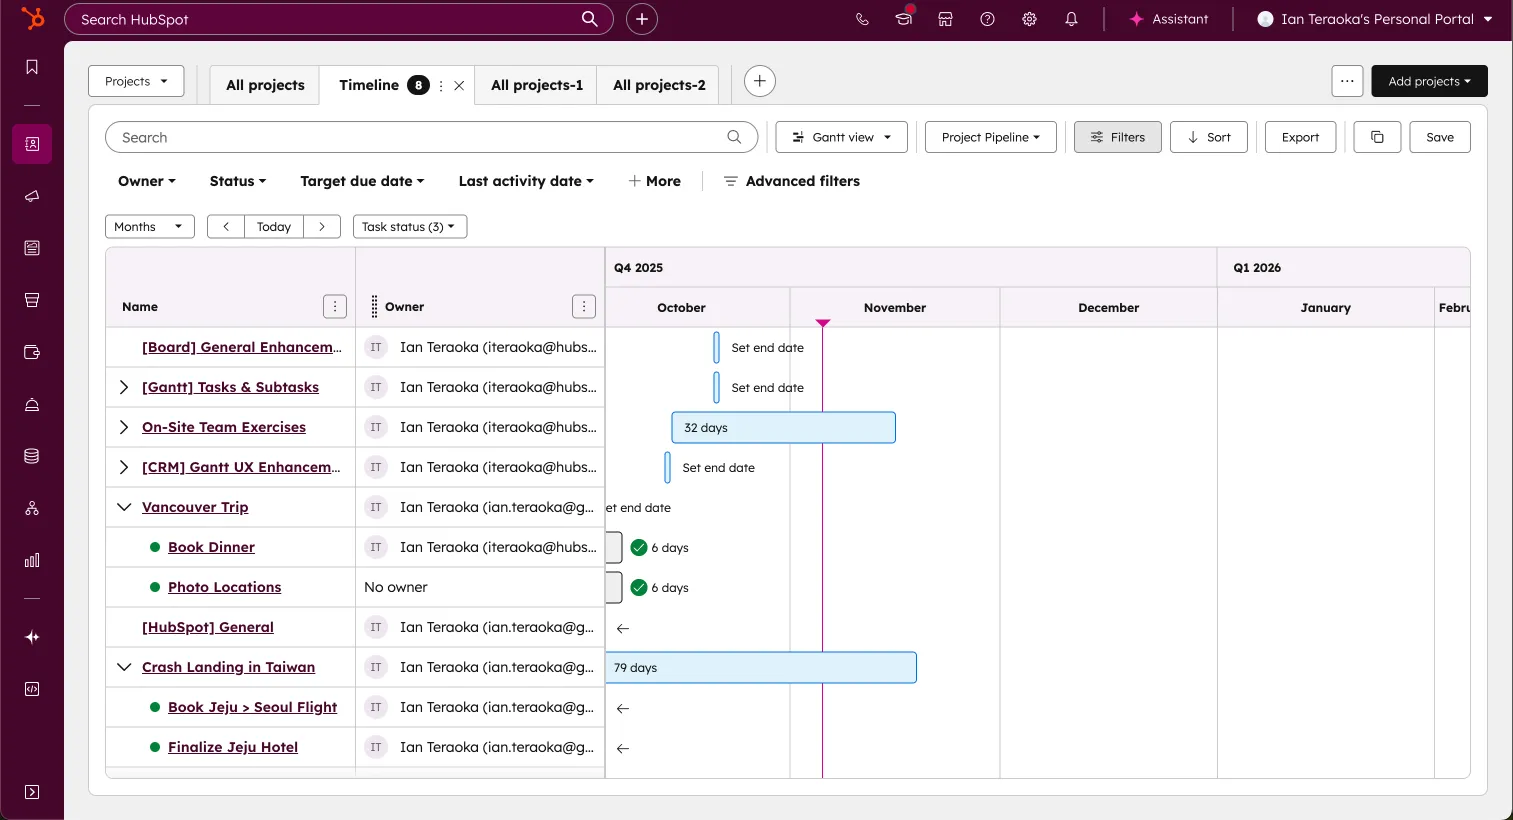
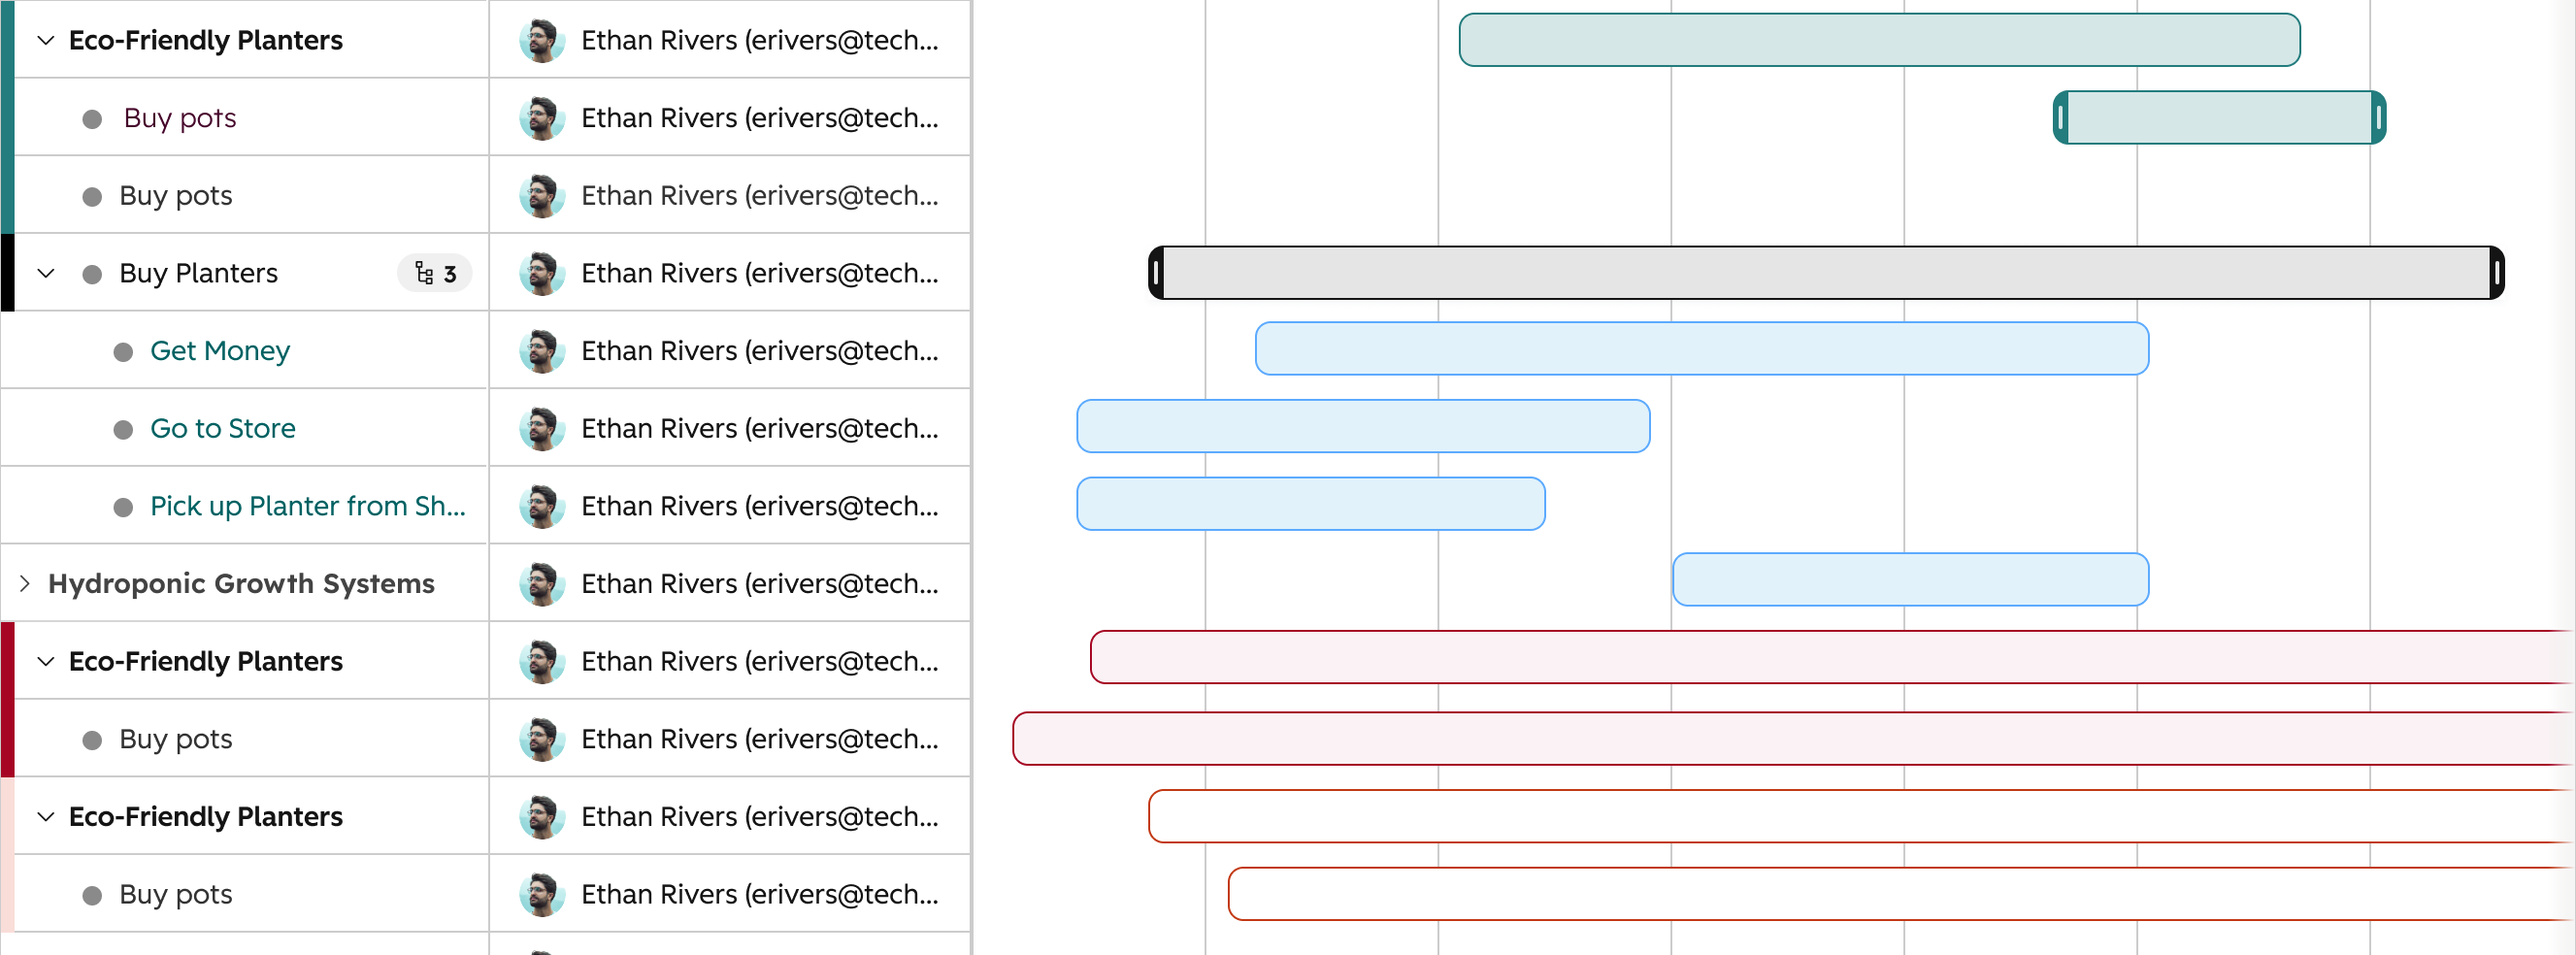
Key improvements
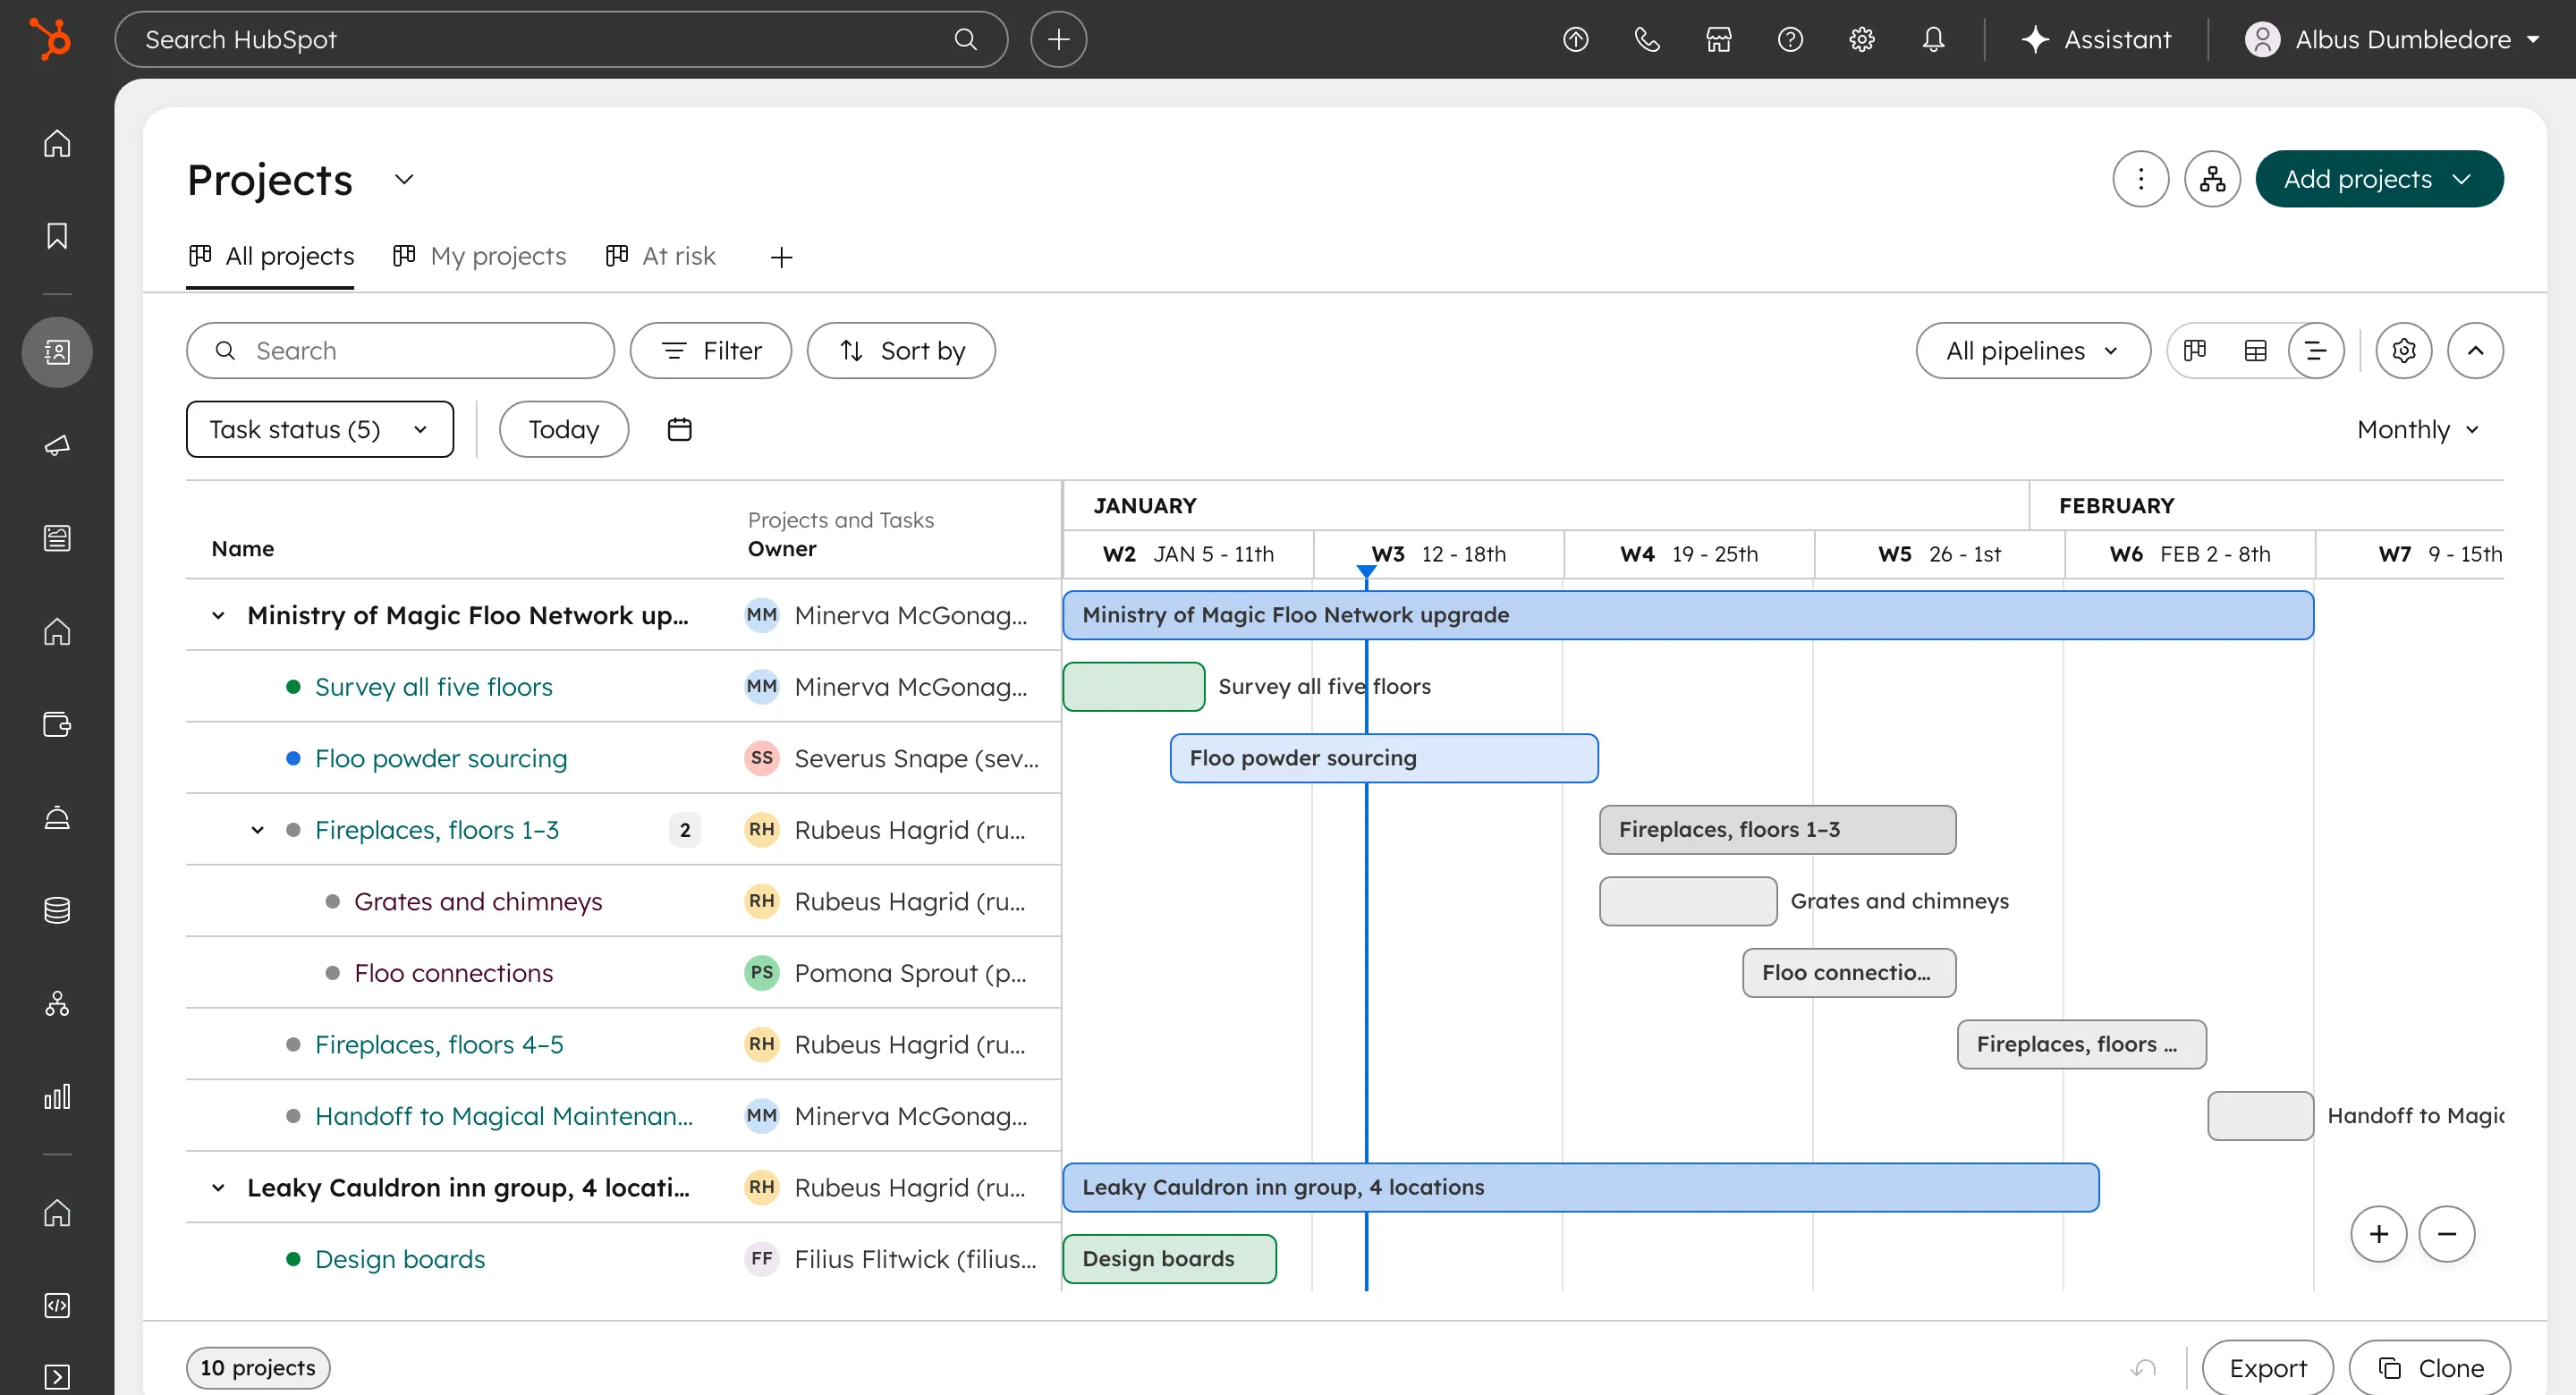
- Defined better hover, selected and draggable experiences
- Introduced row-level actions
- Added timeline scaling controls, including pinch to widen or narrow
- Added a settings experience
- Merged certain property types into single columns to save space
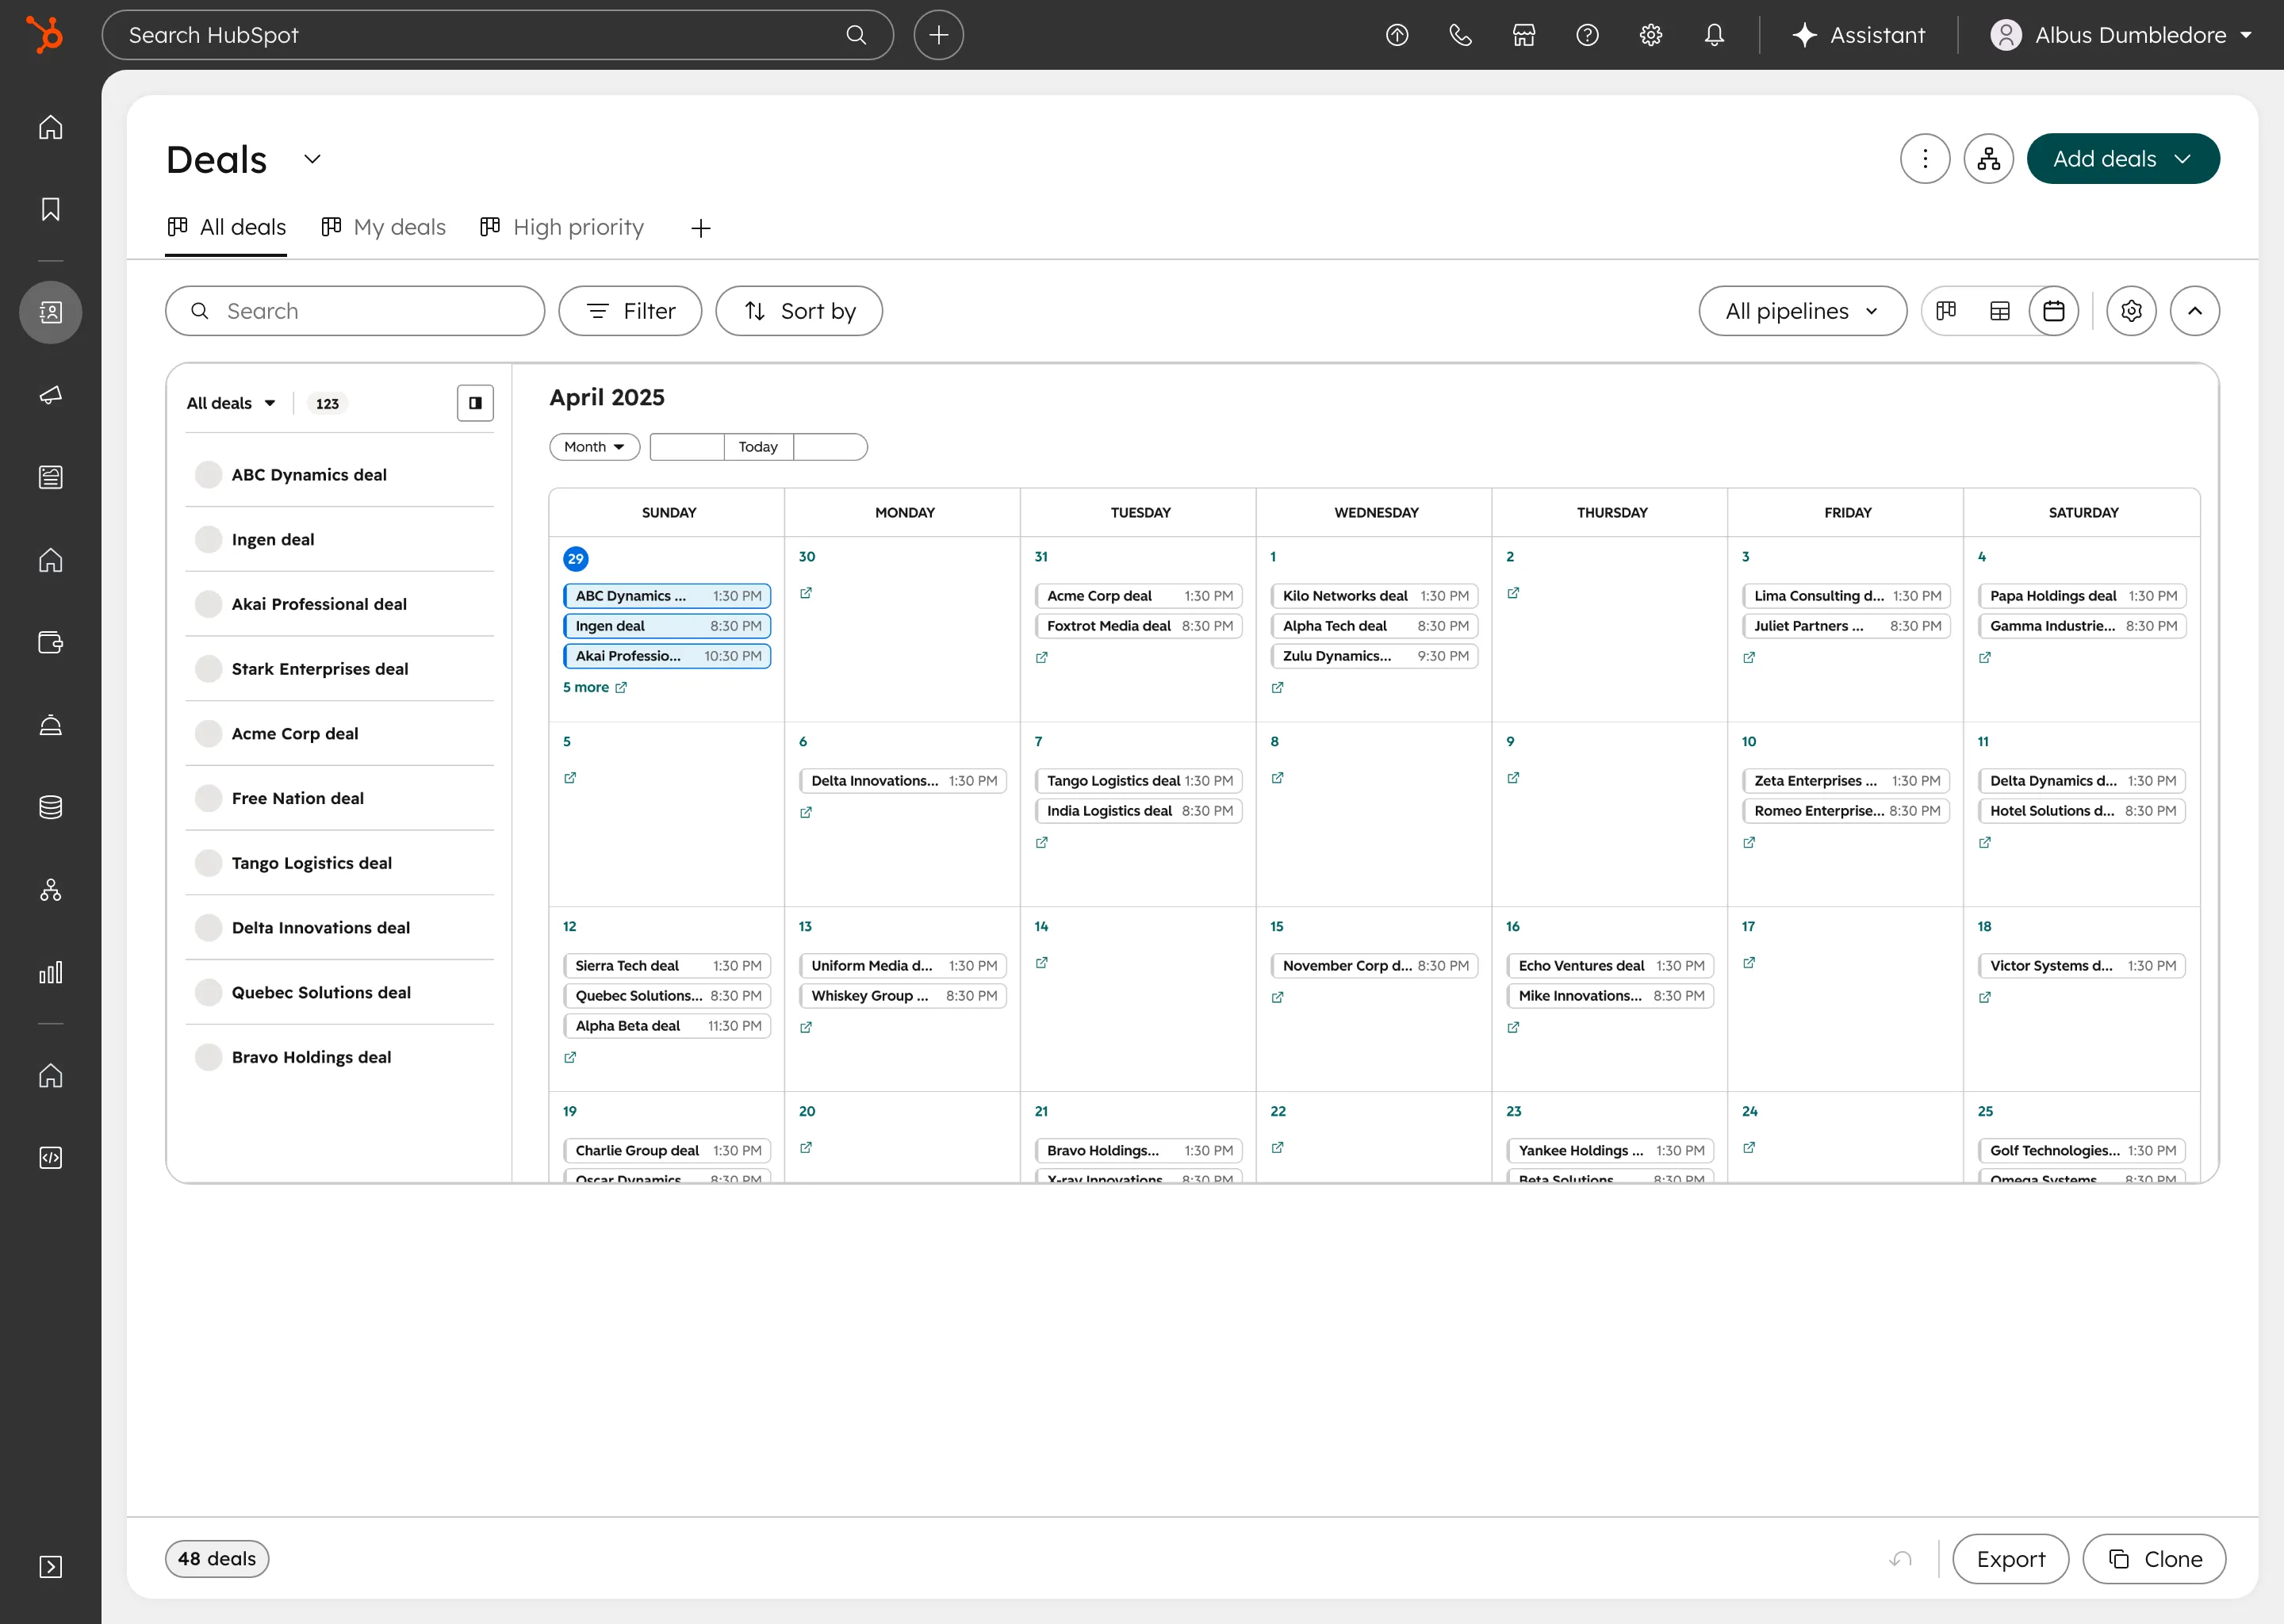
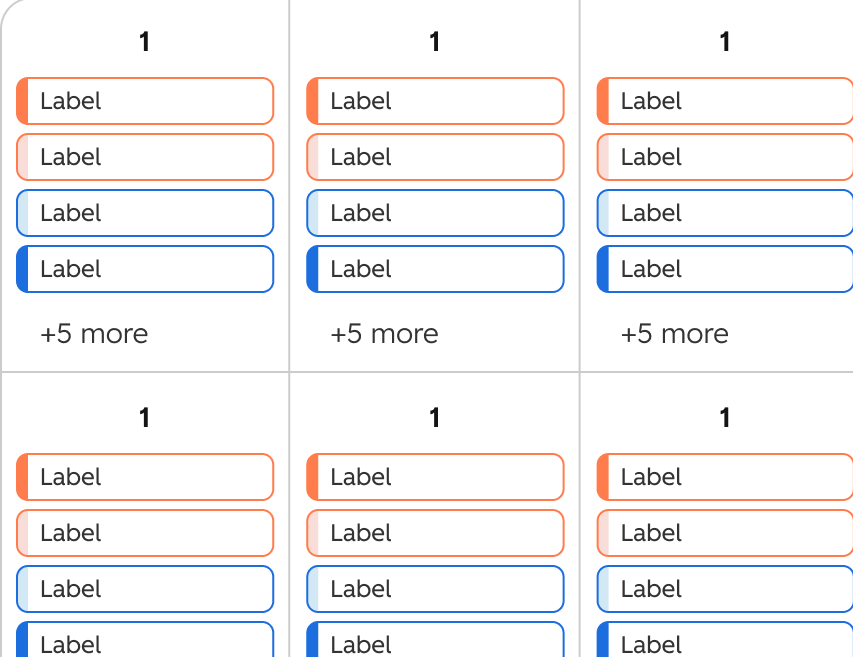
Key improvements
- Improved overall responsiveness across screen sizes
- Defined color management, icon and customization placements
- Cleaned up the Calendar toolbar, introducing Jump to and Today controls
The other visualizations lagged behind Board. Once the Board visualization framework was defined, I scaled it to Gantt and Calendar, as well as influenced our other two visualizations (Table and Map), and carried what Board proved into each of them.
I also worked with the Design Systems team during their redesign to make sure the changes we made were reflected in the updated system, and introduced a denser size and scale foundation for our visualizations, open to any other team that wanted to use it.
Framework influence
Expanding the Framework to Visualizations and Teams
Every object had at least Board and Table as part of its default visualizations. Other objects were slowly opting into the other visualizations where it made sense.
We often had a core team that we worked with on each visualization as our “primary use case” to solve for, but we had a number of other teams that used certain visualizations as well. I worked with those designers to understand where we wanted consistency in our framework, and decided when it made sense for the user to break off from it.
Notable Design Decisions
-
Sales Deal Progression
AI recommendations on the card → the deal’s next step comes first, general suggestions only when there isn’t one.
-
Help Desk
Settings their customers couldn’t follow → settings that show the real board, through the shared index.
-
Marketing Studio
A clashing color system → kept what their users relied on, reconciled the rest.
-
Sales
Pipeline phases and approvals → built from Board’s patterns, not custom screens.
-
Projects
Gantt for the new Projects object → Board’s interactions, extended for drag, zoom and subtasks.
-
Most other objects
Board as a default view → every improvement, for free.
The rule behind every call I made was to stay as consistent with the platform as possible, and diverge only where a team’s users need it. I wanted to treat the platform visualization framework as a curation tool, not a restriction.
Outcomes
One Framework, Five Visualizations
NPS went up, and tickets for outstanding features and complaints dropped significantly.
Attributing every result was hard. Some teams didn’t have robust tracking built out yet, other updates to the same pages (index headers, the broader redesign) shipped alongside ours and muddled the data, and rollouts had to follow a set process together.
- Shared user flows, interactions and visual treatments across all five visualizations.
- Product teams’ requests became shared patterns instead of one-offs.
- The card space freed on Board became HubSpot’s AI entry point across objects.